 |
The absence of mantle plumes beneath the European Cenozoic Rift System |
Andreas Fichtner1 & Antonio Villasenor2
1Department of Earth Sciences, ETH Zurich, Switzerland; andreas.fichtner@erdw.ethz.ch
2ICTJA-CSIC, Barcelona, Spain; antonio@ictja.csic.es
This webpage is a summary of: Fichtner, A., Villasenor, A., 2015. Crust and upper mantle of the western Mediterranean - Constraints from full-waveform inversion, Earth Planet. Sci. Lett. 428, 52-62.
Summary
We present a full-waveform tomographic model of the western Mediterranean crust and mantle constructed using complete three-component recordings from permanent and temporary networks. The incorporation of body and multi-mode surface waves in the period range from 12-150 s allows us to jointly resolve crustal and mantle structures, including the Guadalquivir, Tajo and Ebro basins at shallow depth, as well as the western Mediterranean subduction system in the transition zone. No mantle plumes can be detected beneath the European Cenozoic rift system, including the Massif Central. In addition to the well-studied Alboran slab, a strong E-W trending high-velocity anomaly is present around 200-300 km depth beneath the Algerian coast. This previously undetected African slab is detached from the surface and broken into two segments. It may be interpreted as the slab that caused the opening of the Liguro-Provencal basin through successive roll-back between 35-15 Ma.
Full-waveform inversion: Data and Method
Following early developments in the 1980s (e.g., Lailly, 1983; Tarantola, 1984), full-waveform inversion has recently developed into a viable tool for the assimilation of seismic waveform data into 3-D Earth models (e.g., Chen et al., 2007; Tape et al., 2010; Rickers et al., 2013). Using complete seismograms, including body and surface waves, constrains both crustal and mantle structure without requiring crustal corrections. The vertical smearing inherent in pure body-wave tomography is reduced, thus avoiding the appearance of artificial plume-like features.
The data used in this study are a compilation of three-component seismograms from earthquakes that occurred in the Mediterranean region. For broadband stations belonging to permanent networks we obtained waveform data from IRIS and ORFEUS. We complemented this dataset with data from regional networks and temporary broadband deployments, the largest of which is IberArray (Diaz et al., 2009). The PASSCAL experiment PICASSO and arrays deployed by the Universities of Münster (Germany) and Bristol (UK) greatly improved the coverage. To prepare the data for the inversion we removed instrument responses and bandpass filtered between 12 and 120 s period. We then inspected all recordings and rejected those where the signal-to-noise ratio was below 10. Our final dataset contains 13,089 three-component recordings from 52 events.
Our model constitutes a regional refinement of the Eurasian model by Fichtner et al. (2013). For the regional refinement in the western Mediterranean we apply full-waveform inversion based on spectral-element solutions of the anisotropic, visco-elastic wave equation.
Resolution analysis
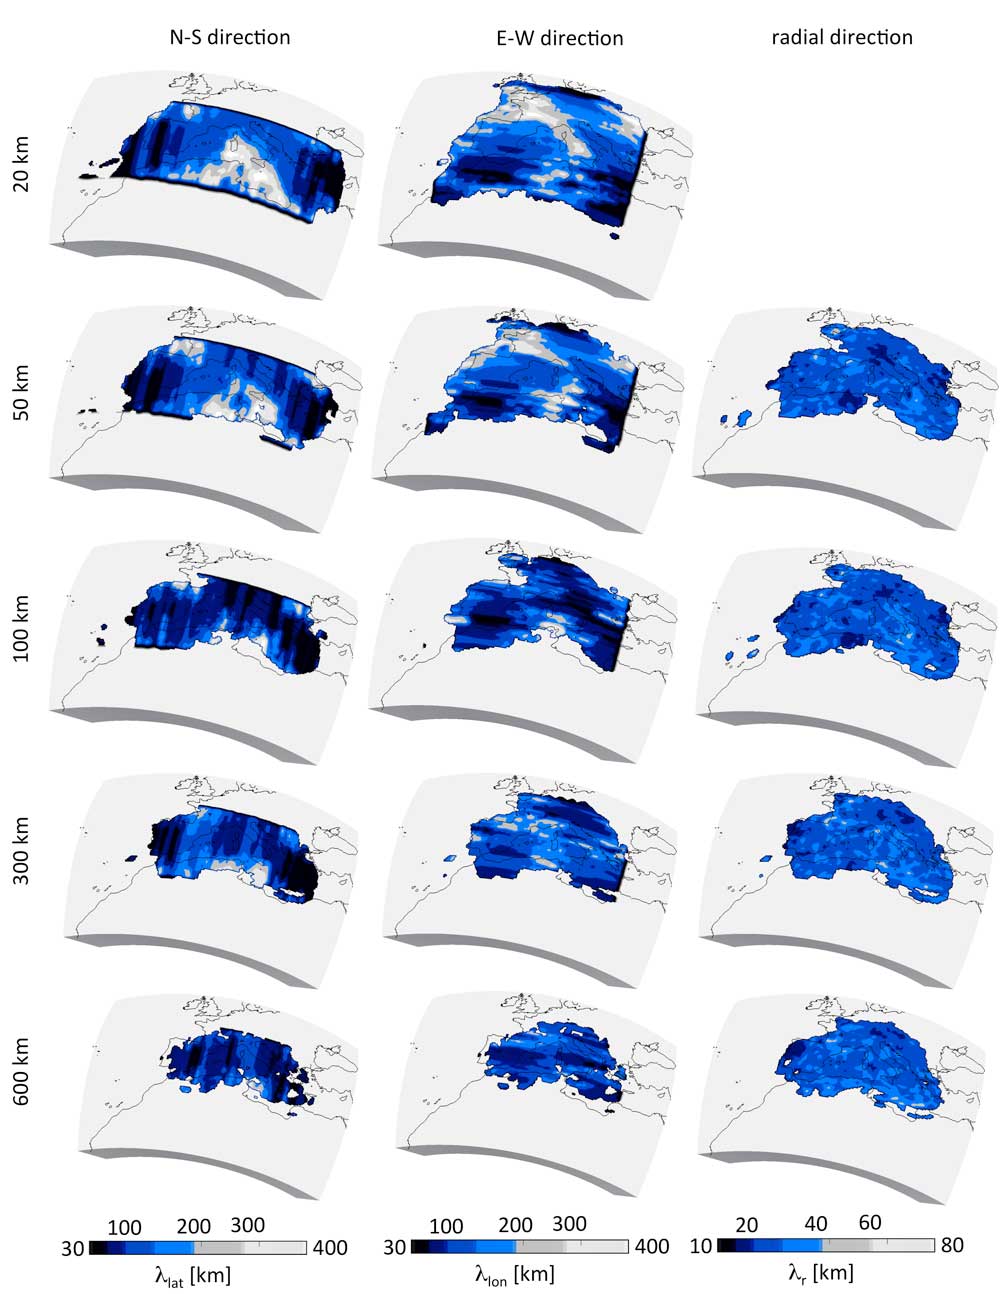
Before presentation of the final model, we provide a resolution analysis that will later serve as interpretative aid. We quantify resolution in terms of direction- and position-dependent resolution length, defined as the width of the point-spread function in a given location and direction. Based on random probing techniques (Fichtner & van Leeuwen, 2015), our resolution analysis is more quantitative and less computationally expensive than recovery tests of the checkerboard type that may be misleading, even if the Earth were indeed a checkerboard. Figure 1 summarizes the 3-D distributions of resolution length in N-S, E-W and radial directions. As already observed in ray tomography, resolution length is strongly heterogeneous and anisotropic. In the horizontal directions, resolution length within the upper 50 km varies from 30-400 km. While local minima at shallow depth appear beneath the Aegean and the Iberian Peninsula where coverage is dense, resolution is poorer beneath the south-central Mediterranean where few surface ray paths cross. Resolution length in the radial direction is more homogeneous and shorter than in the horizontal directions because fundamental- and higher-mode surface waves enter the inversion.

Figure 1: Resolution length in the N-S direction (left), E-W direction (centre) and radial direction (right). Regions where the volume of the local point-spread functions is below 1% of the maximum point-spread function volume are blank. Click here or on Figure for enlargement.
Shear velocity structure of the upper mantle
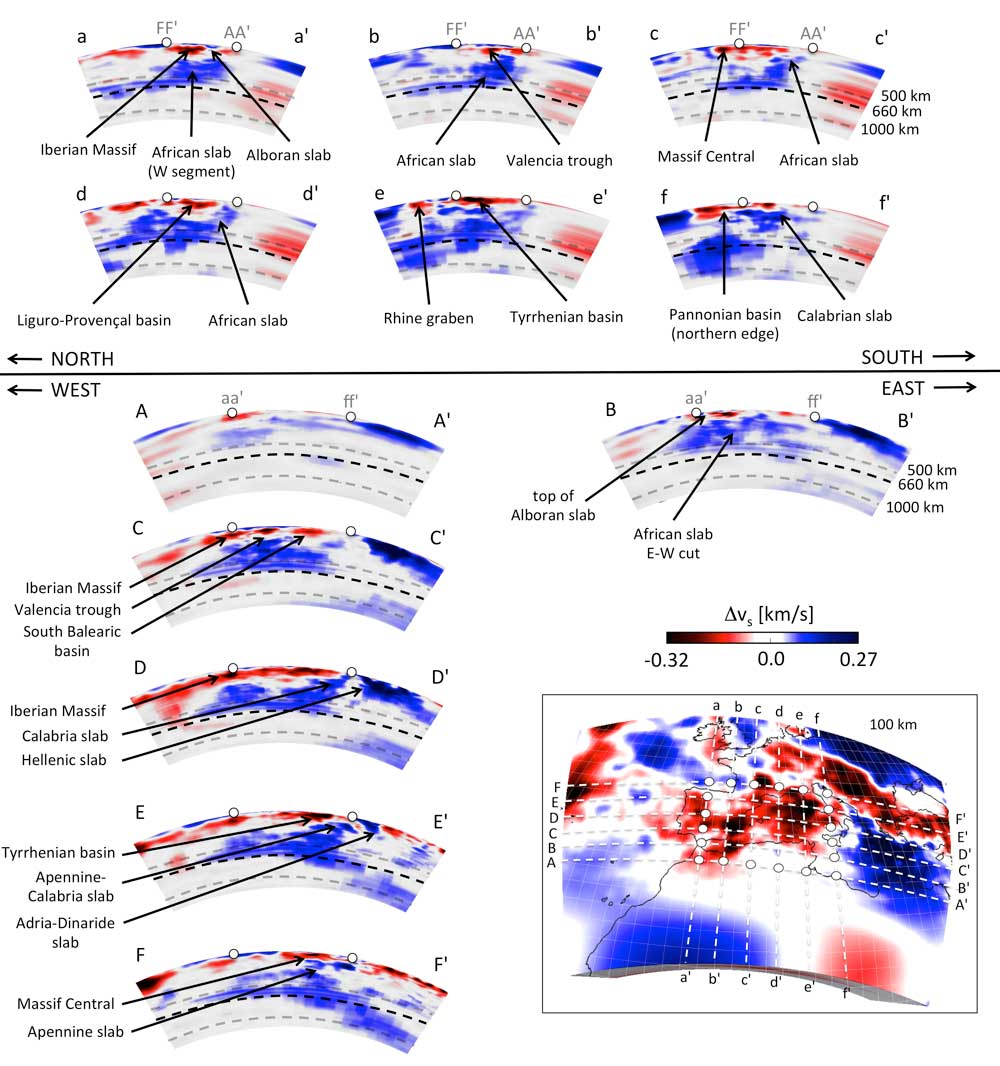
Figures 2 and 3 show vertical and horizontal cross sections through the final S-wave velocity model. Pronounced low-velocity anomalies appear beneath the Liguro-Provencal basin, the Massif Central, and the Olot volcanic field, but also beneath southern and western Iberia where recent volcanism is absent. All of these anomalies are confined to the upper 150 - 200 km of the mantle. At depths below 150 km, mantle structure is dominated by the high-velocity anomalies of the Mediterranean subduction system. The eastward dipping Adria-Dinaride slab and the westward dipping Calabria slab are well-defined and clearly visible in cross-section DD' of Figure 2. The Alboran slab, as well as various pronounced E-W trending high-velocity segments beneath the Algerian coast appear in cross-sections aa' to dd'.

Figure 2: Vertical slices through the absolute variations of isotropic S-wave velocity from 50 - 1200 km depth. N-S oriented slices are shown in the top rows, and E-W oriented slices are shown below. Dashed lines are plotted for orientation at 500, 660 and 1000 km depth. The location of the profiles is indicated in the inset which shows S-wave velocity variations at 100 km depth. White dots in the inset correspond to white dots in the vertical slices. Click here or on Figure for enlargement.

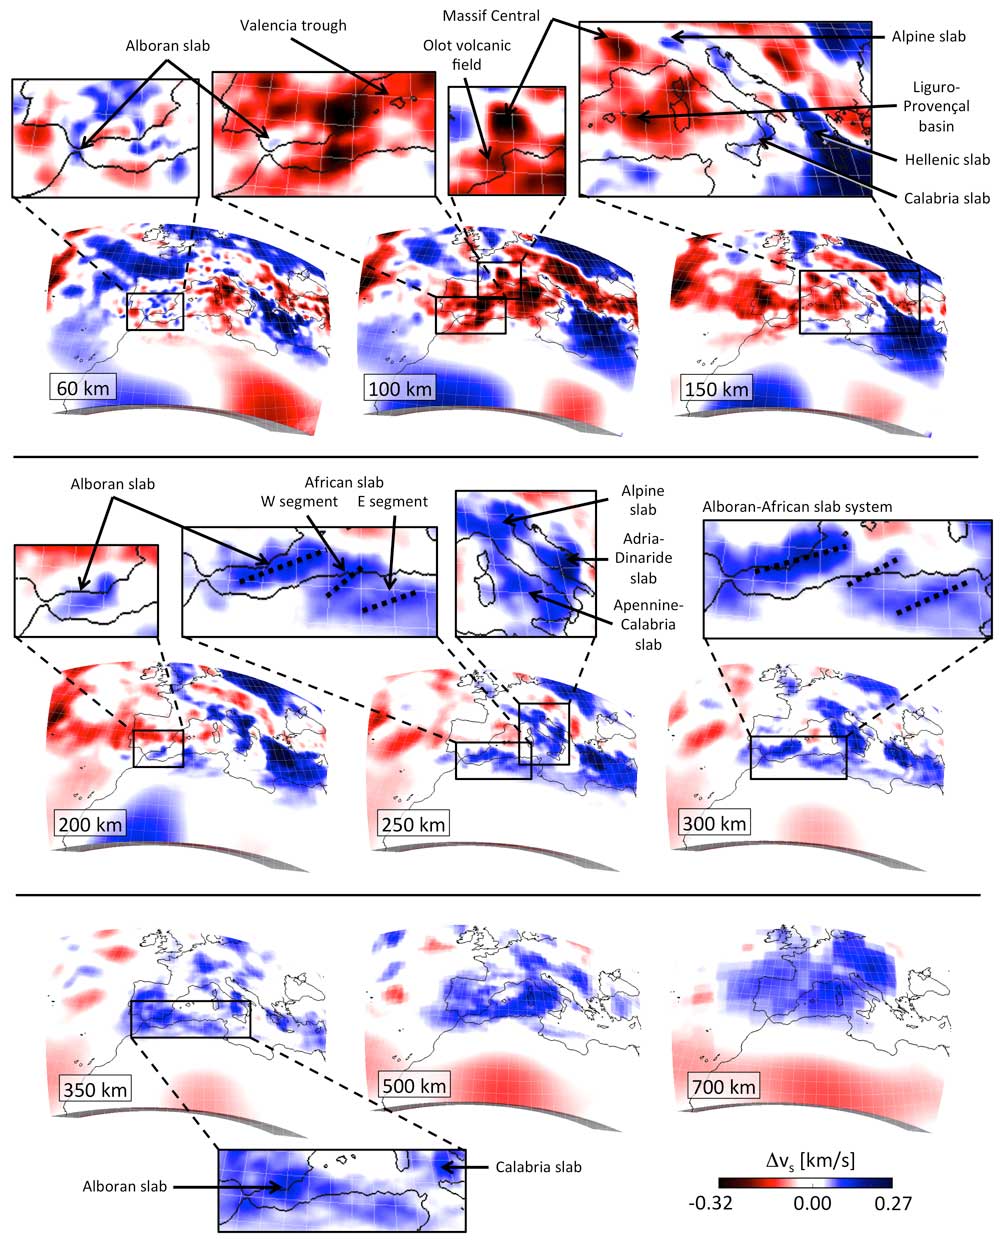
Figure 3: Horizontal slices through the absolute variations of isotropic S-wave velocity from 60 - 700 km depth. Features mentioned in the text are labeled. Dotted lines in the enlarged panels of the 250 km and 300 km slices mark possible segments of the Alboran-African slab system. Click here or on Figure for enlargement.
Discussion: The European Cenozoic Rift System
The most prominent features in the uppermost mantle, shown in Figures 2 and 3, are localized low-velocity anomalies approximately following the European Cenozoic Rift System (ECRS). A continuous corridor of low velocities extends from the Massif Central into northern Africa, with pronounced velocity minima beneath centres of tectonic and volcanic activity. These include the Massif Central, the Catalan Volcanic Zone, and the Valencia Trough. The low-velocity anomaly associated with the Valencia Trough is not directly centred on it, but to the SW, extending beneath the eastern Betics. Furthermore, the ECRS is well imaged in northern Europe where distinct anomalies appear beneath the Bohemian Massif and the upper and lower Rhine Graben. Strong negative anomalies reaching -12% are generally confined to the upper 200 km.
Mantle plumes with vertically elongated tails and laterally spreading plume heads have been repeatedly proposed to be the source of volcanism along the ECRS (e.g., Granet et al., 1995; Goes et al., 1999; Ritter et al., 2001). Such plumes, however, are not present in our model. Our resolution analysis implies that the diameter of a mantle plume between 300 - 600 km depth would have to be less than 100 km in order to remain seismically invisible.
Vertically stretched anomalies are a common feature of teleseismic traveltime tomography that may result from insufficient coverage in the upper mantle where all incoming body waves travel nearly vertically. The addition of surface wave data can reduce the vertical smearing, thereby localizing apparently deep-reaching anomalies to shallower depths. Since the natural combination of body and surface waves in full-waveform inversion does not reveal any mantle plumes beneath central and western Europe, a deep-mantle source of volcanism along the ECRS seems unlikely.
References
-
Chen, P., Zhao, L., Jordan, T. H., 2007. Full 3D tomography for the crustal structure of the Los Angeles region. Bull. Seismol. Soc. Am. 97, 1094–1120.
-
Díaz, J., Villaseñor, A., Gallart, J., Morales, J., Pazos, A., Córdoba, D., Pulgar, J., García-Lobón, J. L., Harnafi, M., TopoIberia Seismic Working Group, 2009. The IBERARRAY broadband seismic network: a new tool to investigate the deep structure beneath Iberia. ORFEUS Newslett. 8, 1–6.
-
Fichtner, A., Trampert, J., Cupillard, P., Saygin, E., Taymaz, T., Capdeville, Y., Villasenor, A., 2013. Multi-scale full waveform inversion. Geophys. J. Int. 194, 534-556.
-
Fichtner, A., van Leeuwen, T., 2015. Resolution analysis by random probing. J. Geophys. Res. 120. http://dx.doi.org/10.1002/2015JB012106.
-
Goes, S., Spakman, W., Bijwaard, H., 1999. A lower mantle source for central European volcanism. Science 286, 1928-1931.
-
Granet, M., Wilson, M., Achauer, U., 1995. Imaging a mantle plume beneath the French Massif Central. Earth Planet. Sci. Lett. 136, 281-296.
-
Lailly, P., 1983. The seismic inverse problem as a sequence of before stack migrations. In: Bednar, J., Redner, R., Robinson, E., Weglein, A. (Eds.), Conference on Inverse Scattering: Theory and Application. Soc. Industr. Appl. Math., Philadelphia, PA.
-
Rickers, F., Fichtner, A., Trampert, J., 2013. The Iceland - Jan Mayen plume system and its impact on mantle dynamics in the North Atlantic region: Evidence from full-waveform inversion. Earth Planet. Sci. Lett. 367, 39-51.
-
Ritter, J.R.R., Jordan, M., Christensen, U.R., Achauer, U., 2001. A mantle plume below the Eifel volcanic fields, Germany. Earth Planet. Sci. Lett. 186, 7-14.
-
Tape, C., Liu, Q., Maggi, A., Tromp, J., 2010. Seismic tomography of the southern California crust based upon spectral-element and adjoint methods. Geophys. J. Int. 180, 433-462.
-
Tarantola, A., 1984. Inversion of seismic reflection data in the acoustic approximation. Geophysics 49, 1259-1266.
last updated 2nd August, 2015 |