 |
The stress pattern of Iceland |
Moritz Ziegler1,2, Oliver Heidbach1, Mojtaba Rajabi3, Gylfi Páll Hersir4, Kristján Ágústsson4, Sigurveig Árnadóttir4, Arno Zang1
1Helmholtz Centre Potsdam, German Research Centre for Geosciences, Telegrafenberg, 14473 Potsdam, Germany, mziegler@gfz-potsdam.de ; oliver.heidbach@gfz-potsdam.de ; arno.zang@gfz-potsdam.de
2University of Potsdam, Institute of Earth and Environmental Science, Karl-Liebknecht-Str. 24-25, 14476 Potsdam-Golm, Germany
3Australian School of Petroleum, The University of Adelaide, Adelaide, SA 5005, Australia, mojtaba.rajabi@adelaide.edu.au
4Iceland GeoSurvey (ÍSOR), Grensásvegur 9, 108 Reykjavík, Iceland, gylfi.pall.hersir@isor.is ; sigurveig.arnadottir@isor.is ; kristjan.agustsson@isor.is
This webpage is a summary of: Ziegler, Moritz, Mojtaba Rajabi, Oliver Heidbach, Gylfi Páll Hersir, Kristján Ágústsson, Sigurveig Árnadóttir, Arno Zang, The stress pattern of Iceland, Tectonophysics, 674, 101-113, 2016.
The regional stress pattern along divergent plate boundaries has not been studied extensively yet because of the inaccessibility of submerged mid-ocean ridges. Few and scattered earthquake focal mechanism solutions are the only sources of stress orientation in these areas in the World Stress Map (WSM) database (Heidbach et al., 2008; 2010). Iceland is one of the few places on Earth with an onshore divergent plate boundary (e.g., Einarsson, 1991, Bird, 2003). It is in a unique geological and tectonic setting, where an oceanic ridge (the Mid-Atlantic Ridge) traverses a (purported) mantle plume (e.g., Lawver & Müller, 1994, Allen et al., 2002). The rift zones in and around Iceland are dominated by volcanic systems of different sizes and activities which are postulated to have a plumbing system extended by the hotspot compared to a “normal” divergent plate boundary (Allen et al., 2002).
Iceland received particular attention in the first compilation of present-day crustal stress by Hast (1969). Since then, several researchers investigated the stress in different parts of Iceland. In total, the compilation of stress data records in the World Stress Map (WSM) database 2008 contains 38 data of the contemporary SHmax orientation and the stress regime (Heidbach et al., 2008; 2010). This small data set is not sufficient to map the stress field because it is expected to be highly variable as a result of extensive interactions between tectonic and volcanic processes.
Here we describe a new comprehensive compilation of the contemporary SHmax orientation for Iceland with 495 data records (Figure 1; database available as material supplementary to Ziegler et al. (2016)). The majority of SHmax orientation data records in Iceland are derived from earthquake focal mechanism solutions (35%) and geological fault slip inversions (26%). In particular, we analysed 37 km of borehole acoustic image logs from 57 geothermal wells to interpret present-day stress indicators, i.e. borehole breakouts (BOs) and drilling induced fractures (DIFs). These contribute 20% of the data. In addition, a few SHmax orientations originate from focal mechanism inversions and the alignment of fissure eruptions. All data are quality ranked according to the WSM quality ranking system which assigns qualities of:
- A (reliability of orientation ± 15°),
- B (± 15–20°),
- C (± 20–25°),
- D (± 25–40°), and
- E (>± 40°)
(Zoback, 1992, Sperner et al., 2003, Heidbach et al., 2010).
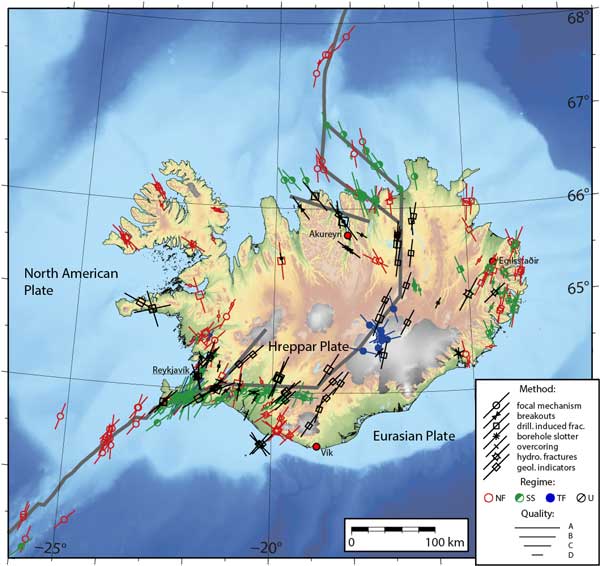
Figure 1: The first comprehensive stress map of Iceland with 307 data records with qualities A-D (World Stress Map quality criteria; Sperner et al., 2003; Heidbach et al., 2010). Lines indicate the orientation of maximum horizontal stress SHmax with line length proportional to quality. Symbols in the middle of the lines indicate the measurement type. Colour coding indicates the stress regime with red indicating normal faulting, green indicating strike slip faulting, blue indicating thrust/reverse faulting, and black for unknown. The plate boundaries according to Bird (2003) and Einarsson (2008) are indicated in grey.
Our data compilation shows that the SHmax orientations derived from different depths and stress indicators are consistent with one another. Present-day SHmax orientations in Iceland fall into four distinct subsets (Figure 2):
- SHmax is ridge-parallel in the southwest along the Reykjanes Ridge and on the Reykjanes peninsula, where the Reykjanes ridge arrives onshore. In South Iceland, where the Hreppar microplate meets the Eurasian plate at the South Iceland Seismic Zone complex transform zone, one of the two areas with the largest earthquakes (up to M 7.2) in Iceland (Einarsson, 2008), the orientation of SHmax is NNE to NE. This is consistent with the observed surface ruptures of large earthquakes.
- In the NE of the South Iceland Seismic Zone the Eastern Volcanic Zone and the Northern Volcanic Zone are active rift zones where most recent rifting events (the Laki, Eldgjá, and Krafla fires and the Holuhraun events) and volcanic eruptions (in the volcanoes Grimsvötn, Gjálp, Askja, Hekla and Barðabunga) have occurred. SHmax follows the orientations of the Eastern Volcanic Zone and Northern Volcanic Zone, considered to comprise the plate boundary running from NE–SW in the south of Iceland to N–S in the north. The same pattern is observed along the east coast.
- In the North, the Tjörnes Fracture Zone connects the Northern Volcanic Zone with the Kolbeinsey Ridge, the continuation of the submarine mid-ocean ridge north of Iceland. This is the second area where large magnitude earthquakes occur. SHmax trends NNW–SSE, mainly inferred from focal mechanism solutions.
- In the Westfjords, the oldest part of Iceland, and also to some extent on the Snæfellsnes peninsula, SHmax rotates from ridge-parallel toward ridge-perpendicular. This rotation is interpreted as transition from ridge-parallel to the common intraplate ridge-perpendicular stress orientation.
Our two key findings are:
-
There is no significant depth-dependent variation in the orientation of SHmax (± 25°), and
-
four distinct contemporary stress provinces are present in Iceland. These provinces correspond to the large-scale regional tectonic setting.
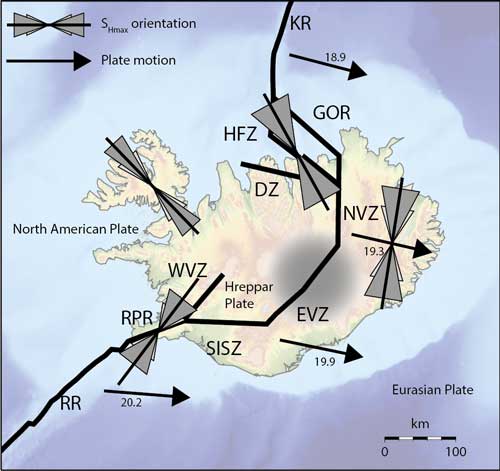
Figure 2: Simplified tectonic map of Iceland showing mean orientations of SHmax in the four stress provinces estimated from the quality A-D data (black lines). The standard deviation from quality A-C is indicated by dark grey triangles. Light grey triangles indicate the standard deviation of quality A-D data. The plate boundaries are from Einarsson (2008) and Bird (2003). The plate motion (mm/yr) is indicated by black arrows relative to a fixed North American plate (Geirsson et al., 2006). The plates and proposed hot spot location are indicated by grey shading (from Wolfe et al., 1997). Tectonic features are labelled according to Einarsson (2008): RR: Reykjanes Ridge, RPR: Reykjanes Peninsula Ridge, WVZ: Western Volcanic Zone, SISZ: South Iceland Seismic Zone, EVZ: Eastern Volcanic Zone, NVZ: Northern Volcanic Zone, HFZ: Húsavík-Flatey-Zone, GOR: Grimsey-Oblique-Ridge, DZ: Dalvík Zone, KR: Kolbeinsey Ridge.
References
-
Allen, Richard M, Nolet, Guust, Morgan, W Jason, Vogfjörd, Kristin, Nettles, Meredith, Ekström, Göran, Bergsson, Bergur H, Erlendsson, Pálmi, Foulger, GR, Jakobsdóttir, Steinunn, Julian, Bruce R., Pritchard, Matt, Ragnarsson, Sturla, & Ragnar, Stefánsson. 2002. Plume-driven plumbing and crustal formation in Iceland. Journal of Geophysical Research, 107(B8), ESE–4.
-
Bird, Peter. 2003. An updated digital model of plate boundaries. Geochemistry, Geophysics, Geosystems, 4(3), 1–52.
-
Einarsson, Páll. 1991. Earthquakes and present-day tectonism in Iceland. Tectonophysics, 189(1-4), 261–279.
-
Einarsson, Páll. 2008. Plate boundaries, rifts and transforms in Iceland. Jökull, 35–58.
-
Geirsson, H.; Árnadóttir, T.; Völksen, C.; Jiang, W.; Sturkell, E.; Villemin, T.; Einarsson, Pá.; Sigmundsson, F. & Stefánsson, R. 2006. Current plate movements across the Mid-Atlantic Ridge determined from 5 years of continuous GPS measurements in Iceland, Journal of Geophysical Research, 111, B09407
-
Hast, N. 1969. The state of stress in the upper part of the earth’s crust. Tectonophysics, 8(3), 169–211.
Heidbach, O., Tingay, M., Barth, A., Reinecker, J., Kurfeß, D., & Müller, B. 2008. The 2008 release of the World Stress Map.
-
Heidbach, Oliver, Tingay, Mark, Barth, Andreas, Reinecker, John, Kurfeß, Daniel, & Müller, Birgit. 2010. Global crustal stress pattern based on the World Stress Map database release 2008. Tectonophysics, 482(1-4), 3–15.
Ito, G., Lin, J, & Graham, D. 2003. Observational and theoretical studies of the dynamics of mantle plume-mid-ocean ridge interaction. Reviews of Geophysics, 41(4), 1017.
-
Lawver, LA, & Müller, RD. 1994. Iceland hotspot track. Geology, 22, 311–314.
-
Sperner, B., Muller, B., Heidbach, O., Delvaux, D., Reinecker, J., & Fuchs, K. 2003. Tectonic stress in the Earth’s crust: advances in the World Stress Map project. Geological Society, London, Special Publications, 212(1), 101–116.
-
Wolfe, Cecily J., Bjarnason, Ingi Th., VanDecar, John C., & Solomon, Sean C. 1997. Seismic structure of the Iceland mantle plume. Nature, 385(6613), 245–247.
-
Zoback, Mary Lou. 1992. First- and second-order patterns of stress in the lithosphere: The World Stress Map Project. Journal of Geophysical Research, 97(B8), 11703.
last updated 29th August, 2016 |