|
|
Variations
in Global Transition Zone Thickness
|
|
|
| |
Introduction
The mantle has complex structure. The mantle transition
zone (TZ) is the layer between two discontinuities
in seismic wave-speed that lie at depths of approximately
410 km and 650 km [Anderson,
1989]. These discontinuities are polymorphic phase
changes, caused by pressure-induced changes of crystal
structure in certain minerals [Anderson,
1967]. In thermodynamic equilibrium, their depths
depend on temperature and composition, and they may
also be significantly affected by departures from
equilibrium in subducted lithospheric slabs. Consequently,
the detailed structure of the transition region contains
the key to a number of geophysical problems [Birch,
1952] and is a subject of intense investigation.
|
| 
Figure 16 from Presnall (1995) |
Background
The TZ was defined by Bullen
as a diffuse region of high seismic wave-speed
gradient extending from 400 to 1,000 km. In
Bullen's nomenclature this was Region C and
the lower mantle (Region D) started at 1,000
km. Birch suggested that the Repetti discontinuity
near 1,000 km marked the top of the lower mantle
and that high seismic wave-speed gradients are
caused by polymorphic phase changes. The early
models of Jeffreys and Gutenberg were smooth
and had high wave-speed gradients without abrupt
discontinuities, but in the 1960s it was discovered
that there are abrupt jumps in seismic velocity
at depths of approximately 400 and 650 km. During
that decade, various investigations, including
detailed studies of the travel times of both
first- and later-arriving body waves, seismic
array measurements of apparent velocities, observations
of reflected waves such as precursors to the
core phase P'P', and analysis of the dispersion
of fundamental and higher-mode surface waves,
all confirmed the existence of the discontinuities.
Thermodynamic considerations were used to argue
that the discontinuities are abrupt phase changes
of olivine to the spinel crystal structure, and
then to a “post-spinel” phase, not
chemical changes, and that the deeper one has
a negative Clapeyron slope [ Anderson,
1967]. This means that cold subducting material
of the same composition as the surrounding mantle
would depress the 650-km discontinuity, inhibiting
vertical motion, and would change to the denser
phase only after warming up or being forced to
greater depth. |
|
There is now confusion in the
geochemical literature about whether 650 or 1,000
km depth is the boundary between the upper and
lower mantles and whether there are chemical changes
deeper than 1,000 km depth. Geochemical studies,
and many convection simulations, assume that the
650-km phase change separates the “depleted
convecting upper mantle” from the “primordial
undegassed lower mantle”. Geodynamic modelers
assume that if the 650-km discontinuity is not
a chemical change then there can be no deeper
chemical change and the mantle is chemically homogeneous.
The TZ thus holds the key to whether there is
whole-mantle or layered-mantle convection. |
|
Unusually low
temperatures, e.g., as expected in a downgoing slab,
will warp the 410-km discontinuity up by about 8 km
per 100 K, and the 650-km discontinuity down by about
5 km per 100 K. Conversely, unusually high temperatures
will depress the 410-km discontinuity and elevate the
650-km discontinuity. This means that the TZ is predicted
to thicken by about 13 km per 100 K where temperatures
are low and to thin by a similar amount where temperatures
are high [Bina & Helffrich, 1994]. The
Clapeyron slopes are uncertain but most estimates for
the total thickening/thinning of the TZ lie in the range
1 km per 6-8 K, or 12-17 km per 100 K.
|
|
Lateral temperature variations
in normal mantle, resulting from plate tectonics
and mantle convection, are predicted to be
at least ~ 200 K, and thus thinning of the
TZ of the order of 20-35 km as a result of
deflection of both discontinuities is expected
without plume heating. Plumes in the lower
mantle need to be much hotter than this to
become buoyant, rise through the high viscosity
lower mantle, penetrate the TZ and erupt in
mid-plate environments [Cordery et al.,
1997].
Chemistry also affects the
depths and sharpness of the discontinuities.
Increasing FeO content decreases the depths
of the discontinuities and generally increases
their thicknesses. Water content is predicted
to increase the abruptness of the 410 km discontinuity.
The pyroxene-“garnet” transitions
also contribute to velocity gradients in the
TZ [Anderson,
1989].
|
|
Several seismological techniques
exist for determining the structure of the TZ, and
its regional variation:
-
Seismic rays from shallow earthquakes
observed at distances between about 1,500 and 3,000
km turn in the transition zone, and are particularly
sensitive to its structure. Studying the travel
times (especially of later arrivals) and waveforms
of these waves can reveal fine structural detail,
but requires unusually dense instrumental coverage.
-
Upward-traveling seismic waves
are partially reflected downward by TZ discontinuities,
and these echoes may appear on otherwise quiet portions
of seismograms at distant stations. These waves
take the form of “precursors” to surface-reflected
seismic phases such as SS, multiple ScS, and P’P’.
-
Similarly, upward-traveling waves
generate converted phases that may be recognizable
on seismograms recorded above the conversion point.
Usually though, these waves reverberate to produce
complicated seismograms, and a special “receiver-function”
technique is used to interpret them.
|
Receiver functions
A widely used tool for studying the TZ is the somewhat
inscrutably named “receiver function”,
which is derived from seismograms of teleseismic earthquakes
recorded at a three-component seismometer in an area
of interest and describes the reverberation of P-
and S-waves between boundaries beneath the seismometer
[Ammon et al., 1990]. For nearly vertically
incident P waves, the vertical-component seismogram
approximates the incident waveform, whereas the horizontal-component
seismograms are dominated by converted shear waves
generated at interfaces beneath the station [Langston,
1979]. The receiver function is the mathematical operator
that describes this process, and it is obtained by
deconvolving the vertical-component seismogram from
the two horizontal-component seismograms. Determining
the structure beneath a station from a receiver function
is a nonlinear inverse problem, which may be solved
by computing the theoretical receiver function for
an initial estimate of the structure and then iteratively
perturbing the structure to improve the agreement
between theory and observation.
The receiver-function method suffers from three
major problems:
-
It is sensitive to velocity discontinuities
but insensitive to absolute wave speeds; “trading
off” wave speeds and interface depths in a
way that preserves the arrival times of reverberating
waves has little effect on receiver functions. Independent
constraints on absolute wave speeds from other sources
are thus needed to provide starting models that
are close to the truth. Surface-wave dispersion
measurements are a convenient source of such information
[e.g., Du
& Foulger,
1999].
| 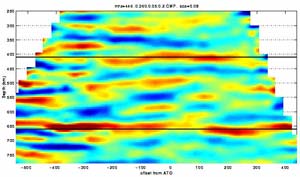
Vertical cross-section of
receiver functions along a NW-SE profile across
the eastern Snake River Plain, near the Yellowstone
hotspot. Colors: zones of rapid increase (red)
and decrease (blue) of seismic wave speed with
depth. Black horizontal lines: nominal depths
of 410- and 650-km discontinuities. From the
website of Ken Dueker, Univ. Wyoming. |
-
Horizontal-component
seismograms, which contain the converted
waves, are frequently noisy. To improve
signal/noise ratios, it is often necessary
to “stack” (add up) seismograms
of several earthquakes with similar locations.
Another approach is to determine structures
for closely-spaced arrays of stations
where structural similarity is expected
and can be used to guide data processing
and interpretation. An example of the
latter approach is shown in the figure
at left.
|
-
Current receiver-function
inversion methods assume the structure beneath
a station is laterally homogeneous. The observations
usually show that it actually is not, because
the receiver functions derived using earthquakes
in different directions differ substantially.
Comparing results from different earthquake
source regions, and from nearby seismometers,
can help in identifying cases of especially
strong lateral variation.
Notwithstanding these problems,
several hotspot locations have been studied in detail
using receiver functions. If the TZ beneath hotspots
is hot, as the plume hypothesis predicts, the TZ
should thin as a result of downwarping of the 410-km
discontinuity and upwarping of the 650-km discontinuity.
|
Observations
The following is an update on global TZ thickness
and interpretations. The average thickness of the
TZ is ~ 242 km, and uncertainties are typically ±7
km for good data and ±15 km for noisy data.
Typical thicknesses beneath high-heat-flow areas
are 220-230 km. The topology of the relevant phase
diagrams predicts antisymmetry in the directions
of deflection of the discontinuities for the cases
of both cold downwellings and hot upwellings [Anderson,
1989]. However, the depths of the 410- and
650-km discontinuities are uncorrelated on a
global scale, even when three-dimensional variations
in wave speed are allowed for. This decorrelation
is a robust global feature [Gu et al.,
2003]. They also sometimes show steps, which
makes interpretation in terms of temperature
not straightforward. Some places show rapid lateral
changes in TZ thickness that may indicate non-thermal
effects. It must therefore be borne in mind that
temperature may not be the only control. The
expected effects of temperature on the depths
of the discontinuities are also based on uncertain
laboratory calibrations, may be in error by a
factor of two, and chemical effects may be stronger
than generally supposed.
| Continents
are typically underlain by a thick TZ and oceans
by a thin TZ, in good agreement with the relative
temperatures broadly expected there. There are
also clear correlations in the case of subduction
zones, where thickening of the TZ is generally
observed. There is abundant tomographic evidence
for the accumulation of slabs at the 650-km
discontinuity [Fukao et al., 2001],
which is expected to cool the TZ and the overlying
and underlying mantle.
Thickness maps of the TZ. Residuals
are interpolated using a spherical harmonic
expansion up to degree 12. The long-wavelength
features are fairly consistent among these maps,
which are dominated by low-degree harmonics
(from Gu
& Dziewonski, 2001). See also Gu et
al., 2001).
|
|
There is, however, no global correlation between
TZ thickness and the locations of surface hotspots
and lower-mantle “superplumes”. For example,
TZ thickness is normal beneath southern Africa (245
km) and the East African Rift and Afar (244 ±
19 km), which are underlain by the South Atlantic
superplume and the postulated Afar plume. TZ thickness
beneath hotspots is generally within the range for
normal oceans and often close to the global average.
Some examples are Pitcairn [226 km; Niu et al.,
2000], Eifel (227 km, flat 650-km discontinuity),
Hawaii (228.8 ±16.8 km) and Easter Island (236.8
±12.2 km). Neither hotspots at the surface,
nor lower mantle superplumes, thus appear to correlated
with anomalously high temperature in the TZ. The TZ
thus appears to buffer the upper and lower mantles
from each other [Anderson,
2001].
The observed topography on the discontinuities does
not seem to be explicable by thermal effects to the
extent expected. The observations are consistent with
the decorrelation of seismic anomalies between the
upper and lower mantles observed both in tomographic
images and revealed by matched filtering using plate/slab
reconstructions. A few anomalies do extend from the
surface through the TZ and into the lower mantle,
and it would be interesting to calculate if they are
more numerous than would be expected by chance.
Detailed study of some specific regions have yielded
surprises. The thinnest TZ region, 181 km, is found
in Sumatra, where a thick accumulation of cold slabs
is thought to exist in the TZ. Within a 1500 x 800
km region of the western USA, the thickness of the
TZ varies from 220 to 270 km, with an average thickness
of 246 ± 9 km. There is 20 to 30 km relief
on each discontinuity, and no correlation is found
with surface geology, topography or between the discontinuities.
According to experimental studies, the 410-km discontinuity
is expected to have 150% of the relief of the 650-km
discontinuity, if thermal effects dominate, but the
opposite is observed in the western USA.
In spite of these complications, TZ thickness may
still prove to be a useful thermometer and an important
part of any plan to map lateral variations of temperature
in the mantle.
|
| Discussion
Bullen’s Region C may be terminated
by a variable-depth discontinuity ranging from 800 to
1,200 km, which may be the Repetti discontinuity [Birch,
1952]. The 650-km discontinuity is undoubtedly mainly
a result of phase changes in mantle silicates, and probably
deepens as the temperature decreases. It appears to
be a barrier to mantle convection [Hamilton,
2002] although slabs may penetrate it locally. The
top of the lower mantle (Bullen’s Region D) is
at about 1,000 km depth and there is evidence from the
scattering of seismic waves that there may be a chemical
boundary near that depth [Anderson, 2002; Niu
& Kawakatsu, 1998]. Much of modern mantle geochemistry
is based on the conjecture that the 650-km phase change
is also a major chemical change, and that this is the
boundary between the upper and lower mantles. Mantle
geodynamics is also based on the assumption that if
slabs can penetrate the phase change they will sink
to the core-mantle boundary. The TZ therefore continues
to be a critical region for investigation. |
-
Ammon, G.J., G.E. Randall, and
G. Zandt, On the nonuniqueness of receiver functions,
J. geophys. Res., 95,
15,303-15,318, 1990.
-
Anderson, D.L., Phase changes
in the upper mantle, Science, 157,
1165-1173, 1967.
-
-
-
Anderson, D.L., The case for
irreversible chemical stratification of the mantle,
Int. Geol. Rev., 44, 97-116,
2002.
-
Bina, C., and G. Helffrich, Phase
transition Clapeyron slopes and transition zone seismic
discontinuity topography, J. geophys. Res.,
99, 15,853-15,860, 1994.
-
Birch, F., Elasticity and constitution
of the Earth's interior, J. geophys. Res.,
57, 227-286, 1952.
-
Cordery, M.J., G.F. Davies, and
I.H. Campbell, Genesis of flood basalts from eclogite-bearing
mantle plumes, J. geophys. Res., 102,
20,179-20,197, 1997.
-
-
-
Flanagan, M.P., and P.M. Shearer,
Global mapping of topography on transition zone
velocity discontinuities by stacking SS precursors,
J. geophys. Res., 103,
2673-2692, 1998.
-
Fukao, Y., S. Widiyantoro, and
M. Obayashi, Stagnant slabs in the upper and lower
mantle transition region, Rev. Geophys.,
39, 291-323, 2001.
-
-
Gu, Y. J., Dziewonski, A. M.,
Su, W.-J., and Ekström, G., Models of the mantle
shear velocity and discontinuities in the pattern
of lateral heterogeneities, J. Geophys. Res.,
106, 11,169-11,199, 2001.
-
Gu, Y.J., A.M. Dziewonski, and
G. Ekstrom, Simultaneous inversion for mantle shear
velocity and topography of transition zone discontinuities,
Geophys. J. Int., 154,
559-583, 2003.
-
Hamilton,
W., The Closed Upper-Mantle Circulation of Plate
Tectonics, in Plate Boundary Zones, edited
by S. Stein, and J.T. Freymueller, DOI: 10/1029/030GD21,
Am. Geophys. Un., Washington, D.C., 2002.
-
Langston, C.A., Structure under
Mount Rainier, Washington, inferred from teleseismic
body waves, J. geophys. Res., 84,
4749-4762, 1979.
-
Niu, F.L., H. Inoue, D. Suetsugu,
and K. Kanjo, Seismic evidence for a thinner mantle
transition zone beneath the South Pacific Superswell,
Geophys. Res. Lett., 27,
1981-1984, 2000.
-
Niu, F.L., and H. Kawakatsu,
Determination of the absolute depths of the mantle
transition zone discontinuities beneath China: Effect
of stagnant slabs on transition zone discontinuities,
Earth, Planets and Space, 50,
965-975, 1998.
-
Presnall, D.C., Phase diagrams
of Earth-forming minerals, in Mineral Physics
and Crystallography: A Handbook of Physical Constants,
AGU Reference Shelf 2, American Geophysical Union,
Washington D.C., 1995.
-
Zhao, L., and S. Chevrot, SS-wave
sensitivity to upper mantle structure: Implications
for the mapping of transition zone discontinuity
topographies, Geophys. Res. Lett., 30,
art. no. 1590, 2003.
|
Recent Transition
Zone Studies
-
Flanagan, M.P. and P.M. Shearer,
Global mapping of topography on transition zone
velocity discontinuities by stacking SS
precursors, J. Geophys. Res., 103,
2673-2692, 1998.
-
Flanagan, M.P. and P.M. Shearer,
Topography on the 410-km seismic velocity discontinuity
near subduction zones from stacking of sS,
sP, and pP precursors, J.
Geophys. Res., 103, 21,165-21,182,
1998.
-
Flanagan, M.P. and P.M. Shearer,
A map of topography on the 410-km discontinuity
from PP precursors, Geophys. Res. Lett.,
26, 549-552, 1999.
-
Shearer, P.M., M.P. Flanagan
and M.A.H. Hedlin, Experiments in migration processing
of SS precursor data to image upper mantle
discontinuity structure, J. Geophys. Res.,
104, 7229-7242, 1999.
-
Shearer, P.M. and M.P. Flanagan,
Seismic velocity and density jumps across the 410-
and 660-kilometer discontinuities, Science,
285, 1545-1548, 1999.
-
Shearer, P.M., Upper mantle seismic
discontinuities, in Earth's Deep Interior: Mineral
Physics and Tomography from the Atomic to the Global
Scale, AGU Geophysical Monograph 117,
115-131, 2000.
-
Gilbert, Hersh J.; Sheehan, Anne
F.; Dueker, Kenneth G.; Molnar, Peter, Receiver
functions in the western United States, with implications
for upper mantle structure and dynamics, J.
Geophys. Res., 108, B5, 10.1029/2001JB001194,
2003.
-
Gilbert, Hersh., A. F. Sheehan,
D. A. Wiens, K. G. Dueker, L. M. Dorman, J. Hildebrand,
and S. Webb, Upper mantle discontinuity structure
in the region of the Tonga Subduction Zone, Geophys.
Res. Lett., 28, 1855-1858,
2001.
-
Gu, Y. J., Upper mantle transition
zone: structure and topography of discontinuities,
Ph.D. thesis, 227 pp, Harvard University, 2001.
-
Gu, Y. J., A.. M. Dziewonski,
and G. Ekström, Simultaneous inversion for
mantle shear velocity and topography of transition
zone discontinuities, Geophys. J. Int.,
in press, 2003.
-
Antolik, M., Y. J. Gu, Adam M.
Dziewonski, and G. Ekström, a new joint model
of compressional and shear velocity in the mantle,
Geophys. J. Int., in press, 2003.
-
Li, X., R. Kind, X. Yuan, S.
V. Sobolev, W. Hanka, D.S. Ramesh, Y. J. Gu, and
A. M. Dziewonski, Seismic detection of narrow strong
oceanic plumes and relation to mantle transition
zone temperature, Geophys. Res. Lett.,
2002.
-
Gu, Y. J., and A. M. Dziewonski,
Global variability of transition zone thickness,
J. Geophys. Res., 107,
B7, 2135, doi:10.1029/2001JB000489, 2002.
-
Gu, Y. J., A.. M. Dziewonski,
and G. Ekström, Preferential detection of the
Lehmann discontinuity beneath continents, Geophys.
Res. Lett., 28, 4655-4658,
2001.
-
Gu, Y. J., and A.. M. Dziewonski,
Variables in thickness of the upper mantle transition
zone, 2nd OHP/ION Joint Sym. Contribution,
edited by B. Romanowicz, K. Suyehiro, and H. Kawakatsu,
pp175-180, 2001.
-
Gu, Y. J., A.. M. Dziewonski,
W.-J. Su, and G. Ekström, Models of the mantle
shear velocity and discontinuities in the pattern
of lateral heterogeneities, J. Geophys. Res.,
106, 11,169-11,199, 2001.
-
Antolik, M., G. Ekström
, A. M. Dziewonski, Y. J. Gu, J. Pan, and L. Boschi,
A new joint P and S velocity model
of the mantle parameterized in cubic B-splines,
22nd Ann. DoD/DoE Seism. Res. Sym. Proc.,
2, 15-23, 2000.
-
Gu, Y. J., A. M. Dziewonski,
and C. B. Agee, Global de-correlation of the topography
of transition zone discontinuities, Earth Planet.
Sci. Lett., 157, 57-67, 1998.
-
Li, X., Kind, R., Yuan, X., Sobolev,
S.V., Hanka, W., Ramesh, D.S., Gu, Y. & Dziewonski,
A.M., Seismic observation of narrow plumes in the
oceanic upper mantle, Geophys. Res. Lett.,
30, 10.1029/2002GL015411, 2003.
|
Discovery
papers: The history of transition zone studies
-
Niazi, M., and Anderson, D. L.,
Upper mantle structure of western North America
from apparent velocities of P waves, J. Geophys.
Res., 70, 4633-4640, 1965.
-
Anderson, D. L., Recent evidence
concerning the structure and composition of the
Earth’s mantle, Physics and Chemistry
of the Earth, 6, 1-131, Pergamon
Press, Oxford, 1966.
-
Toksoz, M., and Anderson, D.
L., Phase velocities of long-period surface waves
and structure of the upper mantle, 1. Great circle
Love and Rayleigh wave data, J. Geophys. Res.,
71, 1649-1658, 1966.
-
Anderson, D. L., Latest information
from seismic observations, Ch. 12, in The Earth’s
Mantle, Academic Press Inc., London, p. 355-420,
1967.
-
Anderson, D. L., Phase changes
in the upper mantle, Science, 157,
1165-1173, 1967.
-
Johnson, L., Array measurements
of P velocities in the upper mantle, J. Geophys.
Res., 72, 6309-6325, 1967.
-
Tokoz, M. N., Chinnery, M. A.,
and Anderson, D. L., Inhomogeneities in the earth’s
mantle, Geophys. J. Royal astron. Soc.,
13, 31-59, 1967.
-
Julian, B. R., and Anderson,
D. L., Travel times, apparent velocities and amplitudes
of body waves, Bull. Seismol. Soc. Am.,
58, 339-366, 1968.
-
Archambeau, C.B. et al., Fine
structure of the upper mantle, J. Geophys. Res.,
74, 5825, 1969.
-
Whitcomb, J. H., and Anderson,
D. L., Reflection of P’P’ seismic waves
from discontinuities in the mantle, J. Geophys.
Res., 75, 5713-5728, 1970.
-
Anderson, D.L., and J.D. Bass,
Transition region of the Earth's upper mantle, Nature,
320, 321-328, 1986.
-
|
last
updated March 2nd, 2004 |
|
|