 |
Constraints on the mantle transition zone structure from P-to-Sv converted waves |
Benoît
Tauzin, Eric
Debayle & Gérard
Wittlinger
Institut de Physique
du Globe de Strasbourg, Ecole et Observatoire des Sciences
de la Terre, Centre National de la Recherche Scientifique
and Université Louis Pasteur, 67084 Strasbourg,
Cedex, France
benoit.tauzin@eost.u-strasbg.fr ; eric.debayle@eost.u-strasbg.fr ; gerard.wittlinger@eost.u-strasbg.fr
1. Introduction
Pressure-induced phase
transitions of olivine give a framework for interpreting
topography perturbations of mantle transition zone
(MTZ) seismic discontinuities in terms of thermal anomalies
in the upper mantle. Two techniques are commonly used
to observe seismically at a global scale the 410-
and 660-km discontinuities: underside reflections of SS precursors
(Deuss,
2007; Gu & An, 2007; Ed: See also
other Transition
Zone pages) and P-to-Sv converted
waves (Chevrot & Vinnik, 1999; Lawrence
& Shearer, 2006). These two approaches have
provided different images of the MTZ, because both
types of data sample the MTZ differently and with
a different resolution (e.g.
Lawrence & Shearer,
2006). SS precursors enable good
global coverage of the MTZ, but with lateral resolution
limited to horizontal wavelengths longer than 2000
km, which remains insufficient for detecting narrow
mantle plumes (Li, 2003). These studies
generally suggest that the MTZ is thinner beneath
oceanic areas than beneath continents (Gu
& Dziewonski,
2002; Li et al., 2000). P-to-S converted
waves provide better lateral resolution (few hundred
of kilometres) beneath the stations. P-to-S converted
waves are, however, less suited to global studies
owing to the small-scale sensitivity of Pds and
the limited geographic distribution of seismometers,
especially in oceanic areas. Recent studies using
both types of data suggest that the MTZ is thicker
beneath subduction zones, in agreement with the Clapeyron
slope of the olivine phase transformations at 410-
and 660-km depths. However, evidence for a thin
MTZ beneath hotspots is more elusive.
This webpage summarises
work presented by Tauzin et al. (2006).
2. Method
We present a new global
study of MTZ seismic discontinuities from PdS converted
waves at the 410- and 660-km discontinuities. We collected
several thousand three-component broadband seismograms
from eight global and regional seismic networks.
The data set is significantly extended compared to
previous studies, with 162 high-quality stations,
compared with the 82 used by Chevrot et
al. (1999) and the 118
used by Lawrence & Shearer (2006). The
data were low pass-filtered at 10 s. We built receiver
functions by iteratively deconvolving the Sv trace
using the P waveform (Ligorria
& Ammon, 1999).
Weak 410- and 660-km phases are enhanced by stacking
in the time-slowness domain the records having the
highest signal-to-noise ratio for each station. In
doing this stacking, we assume the mantle
has no lateral seismic velocity variations beneath
the station. We estimate the data quality from the
noise level, the consistency between the different
receiver functions recorded at each station and the
focusing of P410s and P660s energy
in the τ,p domain.
We define three major
tectonic provinces within the MTZ: the "plume",
"subduction" and "normal MTZ" regions (Figure 1a). The
plume province is defined from a compilation of 65
hotspot locations by Anderson
& Schramm (2005). We
consider 21 of our stations to be underlain by the “plume” province,
which means that we hope that Pds waves
recorded at these stations would detect the influence
of a thermal plume on the MTZ thickness. The subduction
province is defined from the RUM model of Gudmundsson
& Sambridge (1998). Pds waves recorded
at 23 stations sample the subduction province. The “normal
MTZ” region corresponds to the part of the
MTZ which does not belong to the other two provinces.
The 119 remaining stations are therefore assumed
to belong to the "normal MTZ" group of stations.
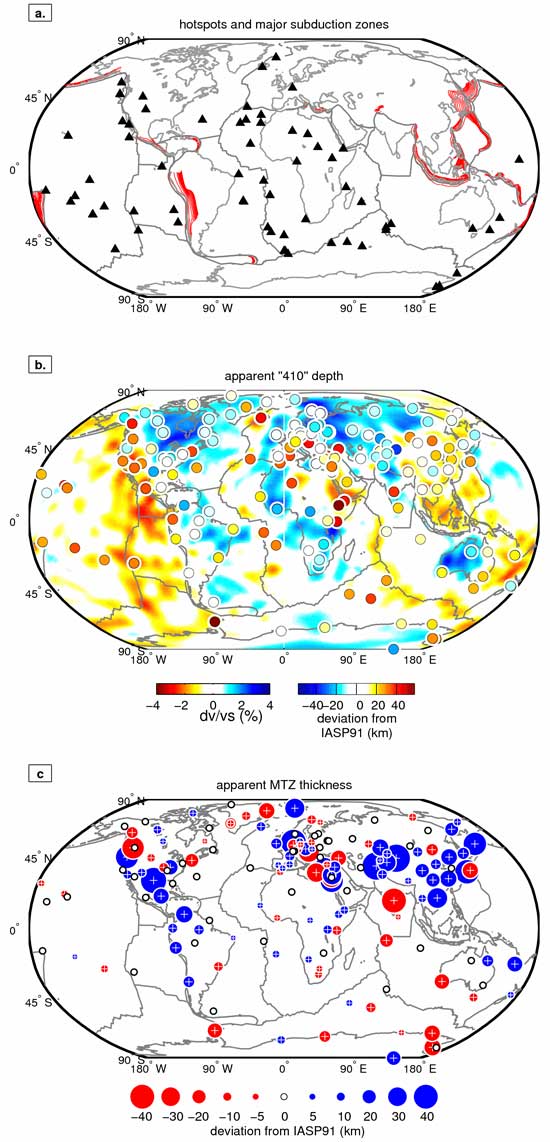
Figure 1. (a) Hotspots
(black triangles) and major subductions zones (red
contours). Depth contours are from Gundmundsson &
Sambridge (1998). Hotspots are from Anderson
& Schramm (2005).
(b) Apparent depth of the "410" seismic
discontinuity. Solid circles show topography variations
of the 410-km discontinuity. Deviations are shown
with respect to IASP91 (410 km). Red (blue) circles
indicate a deeper (shallower) "410". The
background color represents the radial average of
Sv-wave velocity variations in the top 400 km of
the DKP2005 model (Debayle et al., 2005). (c) Apparent
MTZ thickness. The radius of each circle is proportional
to the perturbation from the reference thickness
in IASP91 (250 km).
We take into account
the error measurements with a bootstrap resampling
technique (Efron & Tibshirani, 1991).
We investigate in detail whether there are significant
differences between stations belonging to the different
provinces, consistent with olivine phase transformations.
3. Results
We first convert our
measured travel-times into depth using the IASP91 1D
velocity model (Kennett & Engdahl, 1991).
We observe a strong correlation between the "410"
apparent topography and velocity anomalies above the
MTZ (Figure 1b). The 410-km discontinuity is deflected
downward beneath hotspots and back-arc basins associated
with subductions in the northwest Pacific (Figures
1a and 1b). Archean and
Proterozoic regions are generally associated with a
shallow apparent 410-km discontinuity. The distribution
of apparent "410" depths has a maximum at the expected
depth of 410 km (Figure 2a).
Figure 2. (a) Histogram
of apparent "410" depths. tP410s-tP travel-times
have been converted to depth in IASP91, assuming
there is no lateral velocity variations in the mantle.
(b) Same histogram except that tP410s-tP travel-times
have been corrected for shallow heterogeneities above
410 km using the global shear-wave
tomographic model DKP2005 (Debayle et al., 2005). (c)
Correlation coefficients between velocity anomalies
and uncorrected (dashed) or corrected (solid) 410-km
discontinuity topography at each depth in DKP2005
(Debayle et al., 2005).
The apparent "410"
depths shown on Figure 1b are not corrected for strong
lateral heterogeneities in the top of the upper mantle.
However, there is a clear negative correlation between
the apparent 410-km-discontinuity topography and
lateral variations in seismic velocity in the top 250
km of the mantle, with a maximum of anti-correlation
between 100 and 200 km depth (dashed line in Figure
2c). Corrections for the shallow 3D velocity structure
are expected to affect strongly the apparent 410- and
660-km depths. In return, the MTZ thickness is weakly
sensitive to the strong 3D heterogeneities
above 410 km and provide a more robust constraint.
Figure 1c shows that
lateral variations of MTZ thickness are distributed
in ± 40
km around 250 km in the IASP91 model. These perturbations
are similar to those obtained by Lawrence
& Shearer (2006)
but significantly greater than the ± 10
km obtained by Chevrot et al. (1999). Other
important features of Figure 1c are:
- the observation
of a thick MTZ beneath subduction zones (northwest
Pacific, India, south America and the Farallon plate);
- the absence of clear correlation between a thin
MTZ and hotspots;
- the existence of short-wavelength
topography variations in some regions where a dense
network of stations are available, e.g.,
in Europe;
- the existence of longer-wavelength topography
variations, as evidenced by the gradual westward
thinning of the MTZ from the northwest Pacific subduction
zones to central Asia.
To provide a more complete
view of heterogeneities in MTZ structure, we analyse
jointly the apparent "410" depth and MTZ thickness
beneath our 162 stations (Figure 3). Measurements
at 34 stations (20% of the data set) are within ±10
km of the IASP91 reference values (shown with the
vertical and horizontal dashed lines) and are outlined
by the grey square. Beneath most of the “hotspot” stations,
the 410-km discontinuity is deflected downward, but
the apparent MTZ thickness stays within ± 15
km of the reference IASP91 value (250 km). The
MTZ is generally thickened beneath "subduction” stations.
We also show in Figure 3 the topography variations
expected for a range of thermal anomalies having
the same amplitude at the 410- and 660-km discontinuities
(black line). Topography variations with respect
to the IASP91 model are computed using Clapeyron
slopes of 3 and -2.5 MPa/K for the 410 km and 660
km olivine phase transformations and assuming that
there is no seismic heterogeneity within and above
the MTZ. The tendency of our measurements
is to show a negative correlation between "410"
topography and the MTZ thickness, as predicted from
mineral physics. The large scatter of our observations
confirms previous studies (Chevrot et
al., 1999, Li et
al., 2003), and suggests that Pds absolute
and differential travel-times cannot be explained
only by the topography of the seismic discontinuities.
Other effects, such as 3D velocity variations, need
to be considered.
Figure 3. MTZ thickness
versus apparent depth of the "410" discontinuity.
Travel-times are converted into depth in the 1D model
IASP91. Red squares show measurements at the "hotspot",
blue triangles at the "subduction" and black dots
at the "normal mantle" groups of stations. Grey
dashed lines show the "410" depth and MTZ thickness
for the IASP91 velocity model. They also delimit
four rectangular areas. The upper left area shows
the domain where the MTZ is thick and the 410-km discontinuity
is shallow, while the lower right area delimits the
domain where the MTZ is thin and the 410-km discontinuity
deep. The black line shows the topography variations
expected for a range of thermal anomalies having
the same amplitude at the 410- and 660-km discontinuities.
Topography variations are computed for olivine phase
transformations using the Clapeyron slopes given
in the text.
Velocity heterogeneities
above the MTZ affect the absolute travel times of converted
waves at both discontinuities and are likely to explain
at least one part of the dispersion observed in the
apparent depth of the 410-km topography (Figures 2c
and 3). We try to reduce this dispersion by taking
into account the 3D velocity structure above the MTZ.
For this purpose, we use the recent global shear-wave
tomographic model DKP2005 by Debayle
et al. (2005).
This model provides the 3D distribution of shear-wave
velocities in the top 400 km of the mantle with a
horizontal resolution better than 1000 km beneath continents
and a vertical resolution on the order of 50 km.
Raw measurements of P410s and P660s travel-times
are thus corrected for velocity perturbations relative
to IASP91 and converted into depths (Figures 2b and
4).
Figure 4. Same
as Figure 3, except that the absolute P410s and P660s
travel times have been corrected for velocity heterogeneities
above the MTZ using the
global shear-wave tomographic model DKP2005
(Debayle et al., 2005), before conversion into depth
in IASP91. This correction does not affect the apparent
MTZ thickness but changes significantly the apparent
"410" depth.
After corrections, the
correlation between the "410" apparent topography
and the main seismic heterogeneities between 100 and
200 km has almost disappeared (Figure 2c, solid line).
The dispersion of the "410" apparent depths is significantly
reduced (Figures 2b and 4) and a larger number of measurements
are within ± 10
km of the IASP91 value. 54 stations, or 33% of the
measurements are within the grey square of Figure
4. The whole range of observations has been shifted
to shallower 410 apparent depths. This effect is
particularly important for "hotspot" stations,
because these hotspots are associated with slow velocities
in the top 400 km of the DKP2005 model. Observations
at "subduction" and "hotspot" stations are still
scattered and do not align on the predicted trend
from mineral physics (black line on Figure 4).
4. Discussion
We discuss the apparent
depth of the 410-km discontinuity after corrections
for 3D shallow heterogeneities, in addition to the
MTZ thickness. After 3D shallow corrections, ~30% of
our observations are within ± 10
km of the apparent 410-km depth and MTZ thickness
in the IASP91 model. This proportion increases to
40%, if we restrict our observations to the normal
MTZ subset of stations. The fact that at least 60%
of our "normal
MTZ" measurements cannot be explained by IASP91
suggests that what we call the “normal MTZ” region
is in fact an heterogeneous region. Our coarse a
priori regionalization assumes that the mantle
is unperturbed away from active slabs and hotspots,
without considering the effect of other heterogeneities
such as fossil subduction zones, stagnant slabs,
or plumes that may not have reached the surface.
It is for example possible that the fossil Farallon
subduction contributes to the NW-SE pattern of thick
MTZ observed beneath the “normal MTZ” stations
of north and central America. The average MTZ thickness
of our measurements is 253 km while the average apparent
depth of the 410-km discontinuity after 3D corrections
using DKP2005 is 412 km. It is likely that these
average measurements are biased by the uneven sampling
of our dataset. Results obtained using SS-precursor
data, which provide better sampling of oceanic
regions, generally show that the MTZ is thinner beneath
oceanic regions (e.g. Gu & Dziewonski,
2002). If correct, because our dataset preferentially
samples continents, our average values are likely
to represent an upper bound for the apparent 410-km
depth and MTZ thickness. For this reason, and because
most previous studies have found an average MTZ thickness
within ± 10
km of IASP91, we assume that the apparent 410-km
depth and MTZ thickness in IASP91 are representative
of an unperturbed MTZ.
Two-thirds of the 21 “subduction” stations
are within the upper left part of Figure 4, which
means that for these stations, the MTZ is thicker
and the apparent 410-km depth is shallower than in
IASP91, consistent with the Clapeyron slope of the
olivine phase transition. The dispersion in our measurements
can be explained by insufficient 3D velocity corrections
above the MTZ, the presence of significant
3D velocity variations within the MTZ
or the fact that slabs produces different thermal
anomalies in the vicinity of the piercing points
at 410- and 660-km depths.
The 410-km discontinuity
is deflected downward for most of the "hotspot" subset
of stations, in agreement with the Clapeyron slope
of the olivine phase transition at that depth (Figure
4). The deepening is compatible with hot thermal anomalies
ranging from 100 to 300 K.
For this range of thermal perturbations, pressure-temperature
dependence of olivine phase transformations should
produce a 15 - 40 km thinning of the MTZ. However,
a deep 410-km discontinuity is not always correlated
with a thin MTZ in our observations. Mantle plumes
are thought to originate from a thermal boundary layer,
and it is difficult to imagine that such plumes can
originate somewhere between the 410- and 660-km
discontinuities, especially as some observations of
deep apparent 410-km discontinuities and a thick
MTZ require strong cold anomalies at 660 km.
An alternative
explanation is to consider that structural transformations
of other mantle minerals might contribute to the seismic
signal observed for the 660-km discontinuity. Hirose (2002)
has shown that the majorite/garnet phase transformation
occurs at a depth close to 660 km with a positive
Clapeyron slope, in contrast to the negative slope
of the postspinel phase transition. This phase transition
could dominate the topography of the 660-km discontinuity
in high temperature regions (>1800°C) such as
plumes, resulting in a greater depth for the 660-km
discontinuity. A similar explanation has been proposed
by Deuss
(2007) to explain SS-precursor observations.
If correct, the MTZ thickness may not be a suitable
discriminant parameter to detect deep mantle plumes.
Because the 410-km discontinuity is not affected
by the majorite/garnet phase transformation, the
less robust apparent depth of the 410-km discontinuity
may provide more important information to
detect mantle plumes. Our ability to obtain an accurate
absolute topography for the 410-km discontinuity
relies on our ability to perform accurate 3D shallow
velocity corrections, which is an important issue
to address in future.
Acknowledgements
This work was supported
by the program DyeTI of the Institut National des Sciences
de l'Univers (INSU) at CNRS and by the young researcher
ANR TOMOGLOB. We thank the Iris and Geoscope data centers
for providing seismological data.
References
-
Anderson,
D.L., Schramm, K.A., (2005), Global hotspot maps,
in Foulger, G.R., Natland, J.H., Presnall, D.C.,
and Anderson, D.L., eds., Plates,
plumes and paradigms: Geological Society
of America Special Paper 388, p. 19-29, doi:
10.1130/2005.2388(03).
-
Chevrot,
S., Vinnik, L.P and Montagner, J.P, (1999) Global-scale
analysis of the mantle Pds phases, J. Geophys.
Res., 101,
20203-20219.
-
Debayle, E., Kennett, B.L.N.,
Priestley K., (2005) Global azimuthal seismic anisotropy
and the unique plate-motion deformation of Australia, Nature 433,
509-512.
-
-
Efron, B., Tibshirani, R., Statistical
Data Analysis in the Computer Age (1991), Science,
253, 390-395.
-
Gudmundsson, Ó.,
and M. Sambridge (1998), A regionalized upper mantle
(RUM) seismic model, J. Geophys.
Res., 103(B4), 7121–7136.
-
Hirose, K., (2002), Phase
transitions in pyrolitic mantle around 670-km depth:
implications for upwelling of plumes from the lower
mantle. J. Geophys. Res., 107,
doi:10.1029/2001JB000595.
-
Kennett, B.L.N., Engdhal,
E.R., (1991), Travel times for global earthquake
location and phase identification, Geophys.
J. Int., 105, 429-465.
-
Lawrence, J.F., and P.M. Shearer
(2006), A global study of transition zone thickness
using receiver functions, J. Geophys. Res., 111,
B06307, doi:10.1029/2005JB003973.
-
Ligorra, J., Ammon, C., (1999),
Iterative deconvolution and receiver-function estimation, Bull.
Seismol. Soc. Am., 89,
5, 1395-1400.
- Tauzin,
B., Debayle, E., & Wittlinger, G., (2006), A global
study of transition zone thickness, AGU Fall Meeting
abstract S53A-1300.
last updated 27th
June, 2007 |