|
William D. Frazer & Jun Korenaga
Department of Earth and Planetary Sciences, Yale University, P.O.
Box 208109, New Haven, CT 06520-8109, william.frazer@yale.edu; jun.korenaga@yale.edu
This webpage is a summary of: Frazer, W.D. and Korenaga, J., 2022. Dynamic topography and the nature of deep thick plumes. Earth planet. Sci. Lett., 578: 117286.
Summary
This project was motivated by the discrepancy between the geodynamic predictions of mantle plumes and observations in seismic tomography. Traditional thermal models for plumes predict a conduit radius of ~100 km from the core-mantle boundary to the surface, assuming thermal origins (e.g., Richards et al., 1989). However, global seismic tomography has imaged much larger plumes with radii of up to 400 km in the lower mantle (Figure 1a; e.g., French & Romanowicz, 2015). This presents a major problem for traditional plume models since such a large plume will accommodate far more material than a traditional one, all else being equal. A convenient measure of the amounts of material transported by mantle plumes is buoyancy flux. This depends on plume radius, thermal buoyancy, and viscosity. The buoyancy flux of plumes can be estimated from swell topography and such estimates have concurred with the traditional model of narrow plumes and the low viscosities expected from high temperatures (e.g., Sleep, 1990). The incongruity in predictions and recent tomography observations presented an opportunity to further explore plume dynamics and the origin of hotspot islands.
We chose to focus on an alternative model, a ponding plume, which has been suggested to explain thick plumes together with the buoyancy fluxes estimated from surface topography (Nolet et al., 2006). Such a plume has a large lower-mantle radius (150-400 km) but is significantly narrowed to 100 km in radius in the upper mantle (Figure 1b). All excess material that cannot be accommodated by the much smaller upper mantle plume is assumed to pond beneath the mantle transition zone (MTZ) and spread out laterally below 670 km depth. Mid- and lower-mantle structure is generally not considered when modeling surface topography, but very long-wavelength features can have a significant effect on the surface. We quantified the amplitude of surface uplift using topography kernels which represent the sensitivity of surface topography to subsurface density perturbations. In the case of a ponding plume, the surface is uplifted as a result of the hot thermally buoyant material ponding below the MTZ. The topography kernels are calculated using the propagator matrix method (Hager & O’Connell, 1981) for various vertical viscosity structures.
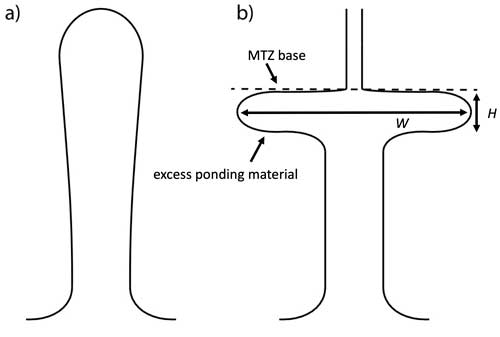
Figure 1. Two end-member geometries of plume conduits. (a) A firm (highly viscous) plume with a relatively slow ascent velocity, and (b) a plume with low viscosity and material ponding beneath the 670 km discontinuity (dashed line). Modified from Frazer and Korenaga (2022).
Using typical plume viscosities (1019
– 1020 Pa s) we find that the ponding of a purely thermal plume would lead to unrealistic excess topography, with the scale of ponding material large enough to be detected by seismic tomography. In many cases, so much material ponds below the MTZ that it would not even in fit in the lower mantle. Figure 2 shows some representative examples of the geometry of ponding plumes that do fit within the lower mantle.
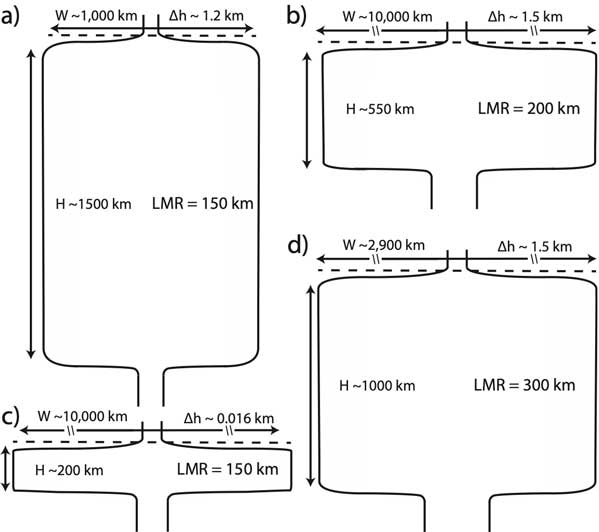
Figure 2. Representative ponding geometries modeled in Figure 3. W is ponding width, Δh is excess topography, H is ponding thickness, LMR is the lower mantle conduit radius. Upper and lower mantle plume radii, ponding thickness, and ponding width are to scale except for those with a break in arrows. (a,b) have μp of 1019 Pa s. (c,d) have μp of 1020 Pa s. Modified from Frazer and Korenaga (2022).
Figure 3 shows surface uplift as a result of material ponding at the base of the transition zone only, without any contribution from spreading of the upper-mantle part of the plume beneath the lithosphere. Plume uplift (Δh) is given as a function of ponding depth (H). If H is greater than ~2200 km, the plume ponding material does not fit within the lower mantle. Most ponding plumes with large radii (300-400 km) and low viscosities are far too large (Figure 3a).
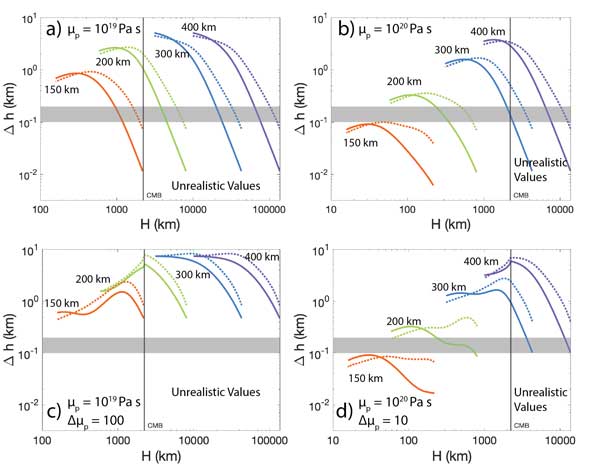
Figure 3. Surface topographic uplift due to a ponding plume at the bottom of the MTZ under various viscosity conditions. An unmodified viscosity structure is used in (a) and (b). (c) and (d) use a modified viscosity structure. μp is plume viscosity and Δμp is the factor by which ambient viscosity was reduced. The solid lines are the topographic response to the 3-layer derived kernels and the dotted lines are for the Mitrovica & Forte (2004) viscosity structure derived kernels. Line color follows the same convention as Figure 2. The gray bar represents 100 m to 200 m of excess topography. The solid black line indicates the depth of the CMB, values beyond this are unrealistic. Modified from Frazer and Korenaga (2022).
Plumes with permissible ponding geometries generate surface uplift on the order of a few kilometers, far greater than typical observations at hotspot swells (King & Adam, 2014). If the radius is reduced or viscosity is increased, the surface response to ponding geometry and surface uplift are lower, but large plume radii (300-400 km) are still highly unrealistic (Figure 3b). Since the scale of ponding material is so large it may modify the vertical viscosity structure. We examined ponding plumes where the ponding material is allowed to reduce the background viscosity structure. Each ponding geometry has a unique viscosity structure and topography kernel depending on H. This modification of the model makes the ponding plume model even more unrealistic (Figure 3c,d). For lower-mantle plume conduits that resemble those observed in tomography, predicted surface uplift is still far beyond what is observed.
An isolated ponding plume with a single upper mantle conduit appears unsupported by observed surface topography. We considered a single large lower mantle plume that feeds multiple upper mantle plumes. Due to the massive amount of material that flows through a 400 km lower-mantle plume, even ten 100 km upper-mantle plumes fed by it can accommodate only ~4% of the upwelling material. A smaller lower-mantle plume radius could have a much greater proportion of its material accommodated by upper-mantle plumes, but the former are smaller than reported by seismic tomography. Mantle plumes might also represent a chemical density anomaly with respect to the ambient mantle. If a plume contains ~20% recycled crust, its buoyancy flux is reduced by two orders of magnitude, and a 300-400 km plume then produces a buoyancy flux similar to estimates from swell topography.
Based on our modeling, it appears that ponding thermal plumes are an unlikely way to reconcile thick plume conduits in the lower mantle with the magnitude of topographic swells. If mantle plumes are as large as imaged by seismic tomography, conventional assumptions about plume rheology or composition may need to be modified. Alternative models that may slow plume upwelling include effects such as grain-size-sensitive creep (Korenaga, 2005) or viscoplastic rheology (Davaille et al., 2018) and thermochemical plumes with a high-density eclogitic component (Dannberg & Sobolev, 2015). As discussed above, thermochemical plumes can sufficiently reduce buoyancy flux to realistic levels but would require all major mantle plumes to be sourced from chemically similar regions. If many plumes originate from large low-shear-velocity provinces (e.g., Burke & Torsvik, 2004), they may share similar chemical characteristics. On the other hand, since grain-size-sensitive creep and viscoplastic deformation are rheological processes, such a plume could occur globally. These possibilities may be distinguished with improvements in seismic tomography and geochemical observations.
References
-
Burke, K., Torsvik, T.H., 2004. Derivation of large igneous provinces of the past 200 million years from long-term heterogeneities in the deep mantle. Earth Planet. Sci. Lett. 227, 531-538.
-
Dannberg, J., Sobolev, S.V., 2015. Low-buoyancy thermochemical plumes resolve controversy of classical mantle plume concept. Nat. Comm. 6, 6960.
-
Davaille, A., Carrez, Ph., Cordier, P., 2018. Fat plumes may reflect the complex rheology of the lower mantle. Geophys. Res. Lett. 45, 1349-1354.
-
French, S., Romanowicz, G., 2015. Broad plumes rooted at the base of the Earth’s mantle beneath major hotspots. Nature. 525, 95-99.
-
Hager, B. H., Clayton, R. W., Richard, M. A., Comer, R. P., Dziewonski, A. M., 1985. Lower mantle heterogeneity, dynamic topography and the geoid. Nature. 313, 541-585.
-
King, S.D., Adam, C., 2014. Hotspot swells revisited. Phys. Earth Planet. Inter. 235, 66-83.
-
Korenaga, J., 2005. Firm mantle plumes and the nature of the core-mantle boundary region. Earth Planet. Sci. Lett. 232, 29-37.
-
Mitrovica, J.X., Forte, A.M., 2004. A new interface of mantle viscosity based on joint inversion of convection and glacial isostatic adjustment data. Earth Planet. Sci. Lett. 225, 177-189.
-
Nolet, G., Karato, S.-I., Montelli, R., 2006. Plume fluxes from seismic tomography. Earth Planet. Sci. Lett. 238, 685-699.
-
Richards, M.A., Duncan, R.A., Courtillot, V.E., 1989. Flood basalts and hot-spot tracks: plume heads and tails. Science. 246, 103-107.
-
Sleep, N.H., 1990. Hotspots and mantle plumes: Some phenomenology. J. Geophys. Res. Solid Earth. 95, 6715-6736.
last updated 16th May, 2022 |