
Maguire et al. (2018)
|
Geophysical modeling informs us about the resolution of deep plume tails |
Wolfe et al. (2009)
|
Ross Maguire
Department of Earth and Environmental Sciences, University of Michigan, Ann Arbor, MI 48109,
*Now at Department of Geology, University of Maryland, College Park, MD 20742; rmaguire@umd.edu
This webpage is a summary of Maguire, R., Ritsema, J., Bonnin, M., van Keken, P. E., & Goes, S. (2018). Evaluating the resolution of deep mantle plumes in teleseismic traveltime tomography. Journal of Geophysical Research: Solid Earth, 123.
The classical plume hypothesis states that thermal upwellings (i.e., plumes) rising from the lower mantle cause hotspot volcanism in locations such as Hawaii and Iceland. Key evidence comes from tomographic images of low wavespeed structures in the deep mantle below hotspots [e.g., Montelli et al., 2004; Wolfe et al., 2009, Rickers et al., 2013, French & Romanowicz, 2015, Nelson & Grand, 2018], due to elevated temperatures in plume tails. However, imaging results are often ambiguous and it is questionable whether narrow plume tails even produce detectable waveform changes. Several factors complicate geophysical interpretation of tomographic images of the mantle below hotspots, including incomplete seismic data coverage, measurement uncertainty, wavefront healing, and the artificial elongation of seismic anomalies along predominant raypaths [Ritsema & Allen, 2003, Hwang et al., 2011, Rickers et al., 2012, Maguire et al., 2016].
In a recent study, Maguire et al. (2018) determine the conditions under which plume tails may be tomographically visible. Our approach is outlined in Figure 1. We develop a set of plume structures by combining geodynamic simulations of plume ascent in a compressible mantle [e.g., Bossmann & van Keken, 2013] with mineral physics relationships between temperature, composition, and seismic wavespeed [e.g., Connolly, 2005]. For each plume structure, we calculate teleseismic wave delay times by simulating 3-D wave propagation [Komatitsch & Tromp, 2002] at periods longer than 10 s. We then design synthetic tomography experiments for a variety of earthquake distributions and seismic network configurations in order to test how well plume tails in the lower mantle can be resolved.
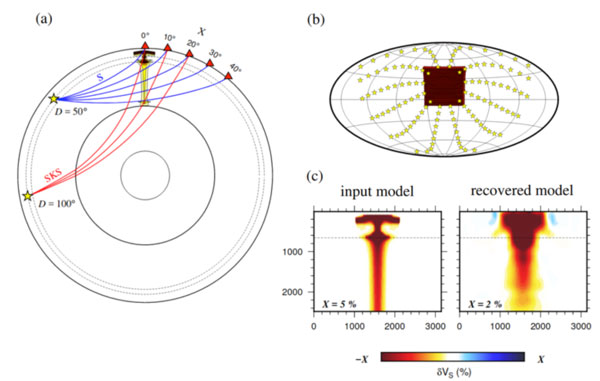
Figure 1: (a) Geometric ray paths of S (blue) and SKS (red) waves sampling a whole mantle plume. Yellow stars are earthquakes and red triangles are seismic stations. (b) Idealized imaging configuration used in synthetic tomography experiments. The plume axis is located at the center of a rectangular network. The earthquakes provide uniform distance and azimuth coverage. (c) Shear velocity perturbation of an input plume model (left) and tomographically recovered plume model (right).
Even for an idealized imaging scenario (as shown in Figure 1b), imaged plume tails are distorted and weakened by 50% or more compared to the seismic anomaly of the numerical plumes. Additionally, we find that if uncertainties on traveltime measurements exceed delay times imparted by plume tails (typically < 1 s), the plume tails are concealed in seismic images.
For a realistic distribution of earthquakes and network configuration, plume resolution is poorer. Figure 2 shows a resolution test for the source-receiver geometry of the Hawaii Plume-Lithosphere Undersea Mantle Experiment (PLUME) [Wolfe et al., 2009]. Using two years of seismicity, we illustrate how a plume head in the upper mantle would be imaged throughout the mantle. The original structure does not have a plume tail but the resolved image below Hawaii includes weak streaks that extend to more than 2000 km depth. These artifacts result from smearing along S and SKS paths from high-seismicity regions in South America and the western Pacific. Such structure could be misinterpreted as tilted plume tails. To obtain optimal resolution of narrow plume tails in seismic tomography we find that wide-aperture (4,000–6,000 km) networks with dense station coverage (<100–200 km station spacing) are necessary. Future efforts to deploy large aperture ocean bottom seismic networks could significantly advance the plume debate.
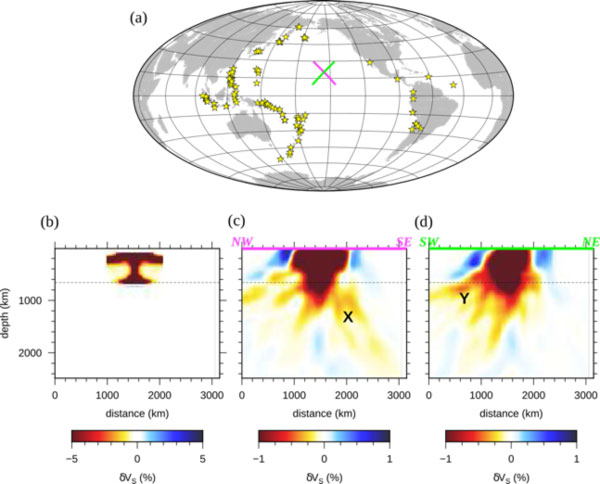
Figure 2: (a) Earthquake distribution used in the inversion, as well as the locations of cross sections through the recovered model. (b) Input structure, which is a plume head confined to the upper mantle. (c) NW-SE cross section through the recovered model. The feature labeled “X” illustrates smearing oriented steeply to the SE due to the prevailing incoming ray direction of South American events. (d) SW-NE cross section through recovered model. The feature labeled “Y” reflects smearing to the SW owing to the prevalence of South Pacific events.
References
- Montelli, R., Nolet, G., Dahlen, F. A., Masters, G., Engdahl, E. R., & Hung, S. H. (2004). Finite-frequency tomography reveals a variety of plumes in the mantle. Science, 303(5656), 338-343.
- Wolfe, C. J., Solomon, S. C., Laske, G., Collins, J. A., Detrick, R. S., Orcutt, J. A., Bercovici, D. & Hauri, E. H. (2009). Mantle shear-wave velocity structure beneath the Hawaiian hot spot. Science, 326(5958), 1388-1390.
- Rickers, F., Fichtner, A., & Trampert, J. (2013). The Iceland–Jan Mayen plume system and its impact on mantle dynamics in the North Atlantic region: evidence from full-waveform inversion. Earth and Planetary Science Letters, 367, 39-51.
- French, S. W., & Romanowicz, B. (2015). Broad plumes rooted at the base of the Earth's mantle beneath major hotspots. Nature, 525(7567), 95.
- Nelson, P. L., & Grand, S. P. (2018). Lower-mantle plume beneath the Yellowstone hotspot revealed by core waves. Nature Geoscience, 11(4), 280.
- Ritsema, J., & Allen, R. M. (2003). The elusive mantle plume. Earth and Planetary Science Letters, 207(1-4), 1-12.
- Hwang, Y. K., Ritsema, J., van Keken, P. E., Goes, S., & Styles, E. (2011). Wavefront healing renders deep plumes seismically invisible. Geophysical Journal International, 187(1), 273-277.
- Rickers, F., Fichtner, A., & Trampert, J. (2012). Imaging mantle plumes with instantaneous phase measurements of diffracted waves. Geophysical Journal International, 190(1), 650-664.
- Maguire, R., Ritsema, J., van Keken, P. E., Fichtner, A., & Goes, S. (2016). P-and S-wave delays caused by thermal plumes. Geophysical Journal International, 206(2), 1169-1178.
- Bossmann, A. B., & van Keken, P. E. (2013). Dynamics of plumes in a compressible mantle with phase changes: Implications for phase boundary topography. Physics of the Earth and Planetary Interiors, 224, 21-31.
- Connolly, J. A. (2005). Computation of phase equilibria by linear programming: a tool for geodynamic modeling and its application to subduction zone decarbonation. Earth and Planetary Science Letters, 236(1-2), 524-541.
- Komatitsch, D., & Tromp, J. (2002). Spectral-element simulations of global seismic wave propagation—I. Validation. Geophysical Journal International, 149(2), 390-412.
last updated 3rd June, 2018 |