 |
The western edge of the African Large Low Shear Velocity Province |
Daoyuan Sun & Meghan S. Miller
Department of Earth Sciences, University of Southern California, Los Angeles, CA 90089, daoyuans@usc.edu ; msmiller@usc.edu
This webpage is a summary of: Sun, Daoyuan and Meghan S. Miller, Study of the western edge of the African Large Low Shear Velocity Province, Geochem. Geophys. Geosys., accepted manuscript online: 3 JUN 2013 06:19AM EST | DOI: 10.1002/ggge.20185
Observations of the Large Low Shear Velocity Provinces (LLSVPs)
The LLSVPs beneath Africa and the mid-Pacific are major features in the lower mantle. They display common degree two features: positive density perturbations of a few percent, and anticorrelated bulk sound velocity and shear velocity. However, their interior structures at smaller scales appear to differ. The Pacific anomaly includes several separated piles and the African anomaly appears to be monolithic [He & Wen, 2012; Helmberger & Ni, 2005; Wang & Wen, 2007].
Extensive studies have been done of the African LLSVP. It has a dome-like structure extending from beneath the southeastern Atlantic Ocean to the southwestern Indian Ocean, and is about 1200 km wide and up to 1000 km high. Studies of rapid variations of travel times and anomaly waveforms concluded that sharp sides exist on the south and east sides [Ni et al., 2002; To et al., 2005]. These were used as the crucial evidence for a thermochemical origin.
The long wavelength heterogeneity of the LLSVPs may be explainable by thermal effects [Davies et al., 2012; Simmons et al., 2009], but purely thermal models have difficulty in satisfying observed structural characteristics of the LLSVP–high-elevation, long-term stability, sharp, vertical sides, and, in particular, the large-scale dome-like shape. Chemical heterogeneities are required to match the seismic observations [Bower et al., 2013; McNamara & Zhong, 2005; Tackley, 2012; Tan & Gurnis, 2007]. Plate motion history may also control the detailed morphology of the LLSVP if it introduces slabs into the lower mantle [Bower et al., 2013; Zhang et al., 2010]. The detailed 3D nature of the African LLSVP is the key to developing a more realistic thermo-chemical convection model. However, up until our study, understanding of the African LLSVP was almost exclusively based on studies of its southern and eastern boundaries.
Imaging the northwestern boundary of the African LLSVP
Dense seismic arrays in the western Mediterranean area allow mapping of lowermost mantle structure on the western edge of the African LLSVP (Figure 1A and B). By examining coherent multipathing signatures across a seismic array, Sun et al. [2009] developed a Multipathing Detector (MPD) to map sharp structures in the deep Earth. The waveform complexities are described quantitatively by parameter ΔLR. Larger values of ΔLR denote stronger multipathing and more distorted waveforms. Here we display examples of the MPD maps for events B and F in the South Sandwich Islands. For event B, strong multipathing of up to ~7 s on the S phases (indicated by red colors) is observed at stations in central to northern Spain (Figure 1C). However, the ΔLR values for the event F are small (Figure 1D, blue colors) across the whole array indicating reduced multipathing effects. The different multipathing patterns between the two events provide direct evidence that the strong multi-pathing features for event B were caused by anomalous lower-mantle structure, i.e. the African LLSVP. Furthermore, the different multipathing patterns also demonstrate the sharpness of the western boundary of the African LLSVP, which is only sampled by event B.
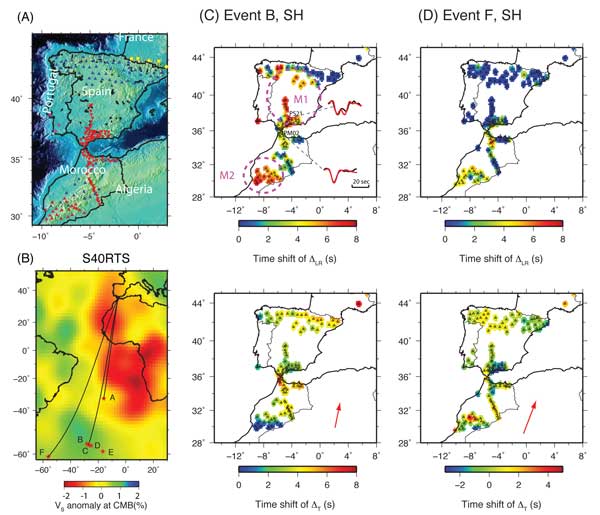
Figure 1: (A) Location map of broadband seismic stations used in this study. Red inverted triangles denote the PICASSO array. Blue triangles denote stations from the IberArray. The orange triangles are the CoMITAC and Munster-Morocco arrays. Yellow circles are stations of the French Broadband Seismological Network. Red and green squares are stations denote LX and PM stations at Portugal. (B) The locations of the events used here (red stars) and the great circle paths to the array depicted by black lines. The tomographic model S40RTS [Ritsema et al., 2011] is plotted for the bottom of the mantle. Note the rays sample the western edge of the LLSVP. Multipathing Detector (MPD) patterns on the SH component for event B and event F are displayed in (C) and (D) respectively. The top rows are DLR maps and the bottom rows are ΔT (travel time) maps. In (C), examples of MPD simulations (red) and data (black) waveforms for PICASSO stations PM02 and PS21 are displayed. The record of PS21 has double arrivals, which produce large ΔLR values (indicated by reds). The red arrow indicates the average direction of ray paths to the array. Click here or on Figure for enlargement.
Model SMWA for the western African LLSVP
We developed our preferred model SMWA (Figure 2A) for the western African LLSVP by fitting both travel times and waveform data. Model SMWA has two subregions, AL1 (the southern portion) and AL2 (the northern portion). AL1 is 600 km, and AL2 400 km above the CMB. The shear velocity reduction inside is 3.5% relative to PREM.
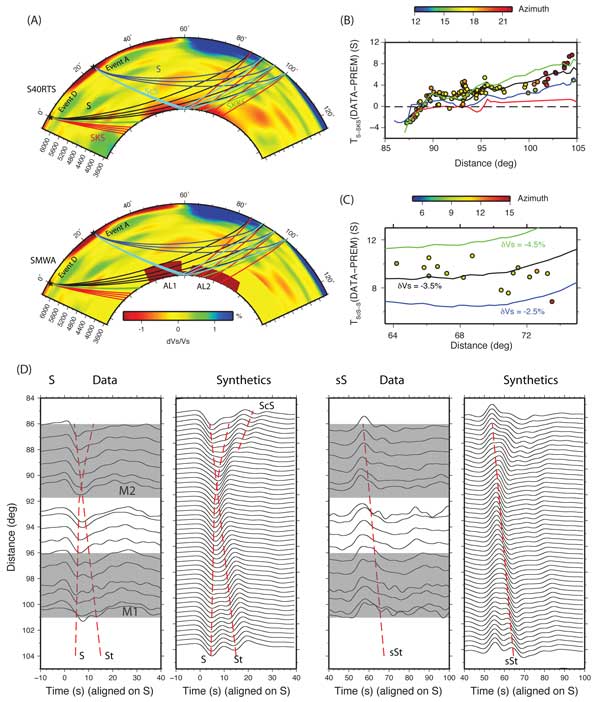
Figure 2: (A) 2D cross sections along the great circle path in Figure 1B of S40RTS and our preferred model SMWA. Also displayed are the ray paths for S (blue for event A, black for event C), SKS (red), SKKS (green), and ScS (cyan). In model SMWA, the shear velocity perturbations inside both the southern (AL1) and northern (AL2) portions are a uniform -3.5%. (B) S-SKS differential travel time compared with PREM for event C. The symbols are color-coded by azimuth. Red lines indicate the predicted travel times for model S40RTS. Other colored lines indicate the predicted travel times for models with the same shape as SMWA but with different velocity anomalies: blue = -2.5%, black = -3.5%, and green = -4.5%. (C) measured ScS-S differential travel times (solid circles) for event A and the prediction for three models with different velocity anomalies. (D) S and sS data for event B and synthetics using SMWA with dVs = -3.5%. The data are stacked over 1.5° distance intervals and aligned on the S arrivals. The 2D synthetics reproduce the extra arrivals for phase St, which are caused by multipathing when rays pass through the sharp top of model SMWA. Two gray shaded regions, M1 and M2, emphasize the distance ranges with strongly distorted waveforms and are shown in map view in Figure 1C. Click here or on Figure for enlargement.
The model satisfies two main observations:
- The differential travel time between S and SKS (TS-SKS) (Figure 2B), which is mainly controlled by lower mantle structure. For distances of 87.5-90°, TS-SKS displays a remarkable jump of up to 6 s. This rapid change indicates that the S waves approach the top of the northwestern part of the African LLSVP parallel to the structure. The initial ascending distance of TS-SKS provides a good constraint on the height of AL1. Furthermore, with the fixed height, the differential travel times between ScS and S (TScS-S) (Figure 2C) for a closer event A constrains the shear velocity inside the LLSVP, which is -3.5% from PREM.
- With a sharp top to model SMWA, two S arrivals are expected (Figure 2D). The first arrival, S, bottoms in the slow African LLSVP. Another phase (St) travels through “normal” mantle above. The crossover distance of these two arrivals also defines the height of the LLSVP. With a height of 600 km for AL1, model SMWA describes the crossover behavior in the data well. In the model, the top of the LLSVP is sharp. Models with a gradational top lose waveform complexity, which is inconsistent with the observations. We found that the transition thickness of the top of the structure is less than 200 km but there may be considerable lateral variations.
Implications
We have robust results concerning the structure at the western edge of the African LLSVP:
- the magnitude of the low shear velocity anomaly is ~3.5%;
- the anomaly extends up to ~600 km above the CMB;
- the top surface of the anomaly is relatively flat;
- the velocity gradient at the top surface is larger than 3.5% per 200 km.
All the observations are consistent with those for the southern and eastern portions of the African LLSVP.
Among those observed features, the gradients of velocity change across the boundaries are useful for distinguishing whether the LLSVPs have a pure thermal or a thermochemical origin. Ni et al. [2002] concluded that the velocity gradient for the sharp vertical wall is > 3% per 50 km. To et al. [2005] suggested a gradient of 4.5% over 100 km. A high-bulk-modulus thermodynamic model is expected to present a sharp vertical wall with a gradient of 3% per 50 km [Sun et al., 2007]. In contrast, a purely thermal model can generate lower velocity gradients of 3-4% per 100 km [Davis et al., 2012]. However, these models mainly focus on explaining the lateral velocity gradient. The velocity gradients across the top of the LLSVP are less discussed. Here, we conclude the top of the western African LLSVP has a velocity gradient larger than 3.5% per 200 km. This is less than observed for the sharp, lateral edges, and agrees with dynamic models.
In the high-bulk-modulus thermodynamic model, the top has a gradient of 3% per 150 km to 250 km, which is similar to our observations here. Furthermore, our 3D image of the African LLSVP suggests that its western portion has continuous high relief across a large area that may connect with the well-studied southern portion. This large-scale dome-like shape is hard to achieve by a purely thermal model, which generates a more ridge-like structure. Therefore, a thermal-chemical model is most likely required to satisfy both the sharp edges and large scale of the African LLSVP.
Note that the height of the northwestern African LLSVP is about half that of the southern portion and is close to that observed for the central Pacific LLSVP [He & Wen, 2012]. Recent thermochemical convection models that include plate motions and subduction processes can generate more complicated morphology, similar to what we observe in both the African and Pacific LLSVPs [Bower et al., 2013; Tan et al., 2011; Zhang et al., 2010]. Nevertheless, a whole 3D image, covering both lateral and vertical variations, is required to understand the origins of the LLSVPs and their links to the plate tectonics.
References
-
Bower, D.J., M. Gurnis, and M. Seton (2013), Lower mantle structure from paleogeographically constrained dynamic Earth models, Geochem. Geophys. Geosyst., 14(1), doi:10.1029/2012GC004267.
-
Davies, D.R., S. Goes, J.H. Davies, B.S.A. Schuberth, H.P. Bunge, and J. Ritsema (2012), Reconciling dynamic and seismic models of Earth's lower mantle: The dominant role of thermal heterogeneity, Earth Planet. Sci. Lett., 353, 253-269.
-
He, Y., and L. Wen (2012), Geographic boundary of the "Pacific Anomaly" and its geometry and transitional structure in the north, J. Geophys. Res., 117, B09308, doi:10.1029/2012jb009436.
-
Helmberger, D.V., and S. Ni (2005), Seismic modeling constraints on the South African Super Plume, in Earth's Deep Mantle: Structure, Composition, and Evolution, Geophys Monograph Series 160, edited by R.D. van der Hilst, J.D. Bass, J. Matas and J. Trampert, pp. 63-81, American Geophysical Union, Washington DC.
-
McNamara, A.K., and S.J. Zhong (2005), Thermochemical structures beneath Africa and the Pacific Ocean, Nature, 437(7062), 1136-1139.
-
Ni, S.D., E. Tan, M. Gurnis, and D. Helmberger (2002), Sharp sides to the African superplume, Science, 296(5574), 1850-1852.
-
Ritsema, J., A. Deuss, H.J. van Heijst, and J.H. Woodhouse (2011), S40RTS: a degree-40 shear-velocity model for the mantle from new Rayleigh wave dispersion, teleseismic traveltime and normal-mode splitting function measurements, Geophys. J. Int., 184(3), 1223-1236.
-
Simmons, N.A., A.M. Forte, and S.P. Grand (2009), Joint seismic, geodynamic and mineral physical constraints on three-dimensional mantle heterogeneity: Implications for the relative importance of thermal versus compositional heterogeneity, Geophys. J. Int., 177(3), 1284-1304.
-
Sun, D., D. Helmberger, S. Ni, and D. Bower (2009), Direct Measures of Lateral Velocity Variation in the Deep Earth, J. Geophys. Res., 114, B05303, doi:10.1029/2008JB005873.
-
Sun, D., E. Tan, D. Helmberger, and M. Gurnis (2007), Seismological support for the metastable superplume model, sharp features, and phase changes within the lower mantle, Proc. Natl. Acad. Sci. USA, 104(22), 9151-9155.
-
Tackley, P.J. (2012), Dynamics and evolution of the deep mantle resulting from thermal, chemical, phase and melting effects, Earth-Sci. Rev., 110(1-4), 1-25.
-
Tan, E., and M. Gurnis (2007), Compressible thermochemical convection and application to lower mantle structures, J. Geophys. Res., 112, B06304, doi:10.1029/2006jb004505.
-
Tan, E., W. Leng, S. Zhong, and M. Gurnis (2011), On the location of plumes and lateral movement of thermochemical structures with high bulk modulus in the 3-D compressible mantle, Geochem. Geophys. Geosyst., 12, Q07005, doi:10.01029/2011gc003665.
-
To, A., B. Romanowicz, Y. Capdeville, and N. Takeuchi (2005), 3D effects of sharp boundaries at the borders of the African and Pacific Superplumes: Observation and modeling, Earth Planet. Sci. Lett., 233(1-2), 137-153.
-
Wang, Y. and L. X. Wen (2007), Geometry and P and S velocity structure of the "African Anomaly", J. Geophys. Res., 112(B5), B05313, doi: 10.1029/2006jb004483.
-
Zhang, N., S. Zhong, W. Leng, and Z. X. Li (2010), A model for the evolution of the Earth's mantle structure since the Early Paleozoic, J. Geophys. Res., 115, B06401, doi:10.1029/2009jb006896.
last updated 26th
July, 2013 |

